Private Equity in Automotive Repair: The 2026 Platforms, Multiples, and Consolidation Map
Private equity in automotive repair is now running four distinct rollups in parallel: general repair, collision, tire, and quick-lube. 2026 multiples split sharply along scale lines: 2x-4.5x SDE for owner-operator shops and 7x+ EBITDA for platform-tier consolidations. Which one lands on your door depends more on your revenue mix and shop count than the sign on your building.


Christoph Totter · Managing Partner, CT Acquisitions
M&A advisory across 500+ active capital partners · Auto aftermarket M&A: mechanical, tire, collision, quick-lube · Updated June 5, 2026
Private equity has built or recapitalized at least 7 verified national platforms across mechanical, tire, and quick-lube auto repair as of 2026, with strategic consolidators (Mavis, Sun, Driven) and PE-backed platforms (Caliber Collision, Service Champions Auto, CarShop) acquiring actively. Multiples range from 2x-4.5x SDE for single-shop operators to 7x-10x+ EBITDA for platform-grade multi-shop operators with $5M+ EBITDA. The full list of auto service franchises covers the active buyers, fee structures, and unit-economics for each.
Methodology and data sources
For 2026 PE investment thesis examples covering how top PE firms link target businesses to fund mandate, name disqualifiers, and capture value, see our reference.
For 2026 how to sell an auto collision repair business with 4x-8x EBITDA multiples and named MSO buyers (Caliber, Gerber, Crash Champions), see our guide.
CT Acquisitions · 2026 Buyer-Market Signal
What Auto Aftermarket PE Buyers Underwrite in 2026
Across our buy-side conversations with auto repair PE platforms and strategic consolidators (Mavis, Sun Auto, Driven Brands, Caliber Collision) in 2026:
- Average repair order (ARO) and revenue per bay are the headline metrics. Bay-level economics tell buyers what a scaled platform can do with the same real estate.
- ASE-certified tech depth and retention beat equipment investment. Buyers can buy new equipment; rebuilding a tech bench takes 18-24 months.
- Tire-vs-mechanical-vs-collision mix drives buyer-platform match. Mavis wants tire-heavy; Caliber wants collision; mechanical-only platforms compete differently.
Multiple at a Glance · 2026
Auto Repair PE Sale Multiples · 2026
By operator scale and end-market mix.
Source: CT Acquisitions analysis of auto aftermarket M&A. Mavis, Sun Auto, Driven Brands, Caliber Collision plus multiple PE-backed mechanical/tire/collision platforms acquire actively.
This tracker follows CT Acquisitions’ 5-tier source hierarchy for research-grade content:
- Tier 1, Press releases from sponsors, platforms, and their advisors (BusinessWire, PR Newswire, GlobeNewswire, sponsor.com/news, platform.com/news)
- Tier 2, SEC filings for public-company comparables (Driven Brands NASDAQ: DRVN, Monro NASDAQ: MNRO, Boyd Group TSX: BYD)
- Tier 3, Sponsor portfolio pages (current portfolio status, not historical)
- Tier 4, Trade press (Tire Review, Tire Business, Modern Tire Dealer, Ratchet+Wrench, Body Shop Business, Autobody News)
- Tier 5, M&A trade press (PE Hub, PE Professional, Focus Advisors, Matthews, PrivSource, Mergr)
Industry-data tier (multiples, market size): IBISWorld NAICS 811111, Peak Business Valuation, Auxo Capital Advisors, Jaken Equities, First Page Sage. All figures are 2024-2026 vintage; older data is labeled.
Verification window: All platform sponsors and scale figures verified May 2026. Recapitalizations, exits, and rollovers happen continuously; see “Future Updates” for the quarterly refresh cadence.
Inclusion criteria for “active platform”: (a) a verifiable current institutional sponsor or publicly traded ultimate parent, (b) at least 25 U.S. locations or $25M+ in revenue, (c) at least one verified add-on acquisition in the last 24 months or a stated active-acquirer posture on the platform’s website.
Why is private equity investing in auto repair now in 2026?
Three structural forces are concentrating capital in auto repair through 2026: Fragmentation runway. The U.S. industry is highly fragmented; the 50 largest companies generate less than 10% of total revenue, and independent shops account for roughly 70% of the market. Source: Grata NAICS 8111 market overview . Non-discretionary demand. Brake jobs, oil changes, alignment, and tire replacement do not pause in a recession. Insurance-mediated work (collision; covered in the auto.
Three structural forces are concentrating capital in auto repair through 2026:
- Fragmentation runway. The U.S. industry is highly fragmented; the 50 largest companies generate less than 10% of total revenue, and independent shops account for roughly 70% of the market. Source: Grata NAICS 8111 market overview.
- Non-discretionary demand. Brake jobs, oil changes, alignment, and tire replacement do not pause in a recession. Insurance-mediated work (collision; covered in the auto body roll-up tracker) is even more recession-resistant.
- EV-cycle ambiguity is a feature, not a bug. Mechanical repair shops worry about EV transition, but the 2026 U.S. EV penetration of new sales is still well under 15%, the installed base is over 280M ICE vehicles, and the average vehicle age is 12.6 years (Bureau of Transportation Statistics). PE underwrites long ICE service tails.
The result: more than $5B of disclosed equity has been deployed into auto repair platforms since 2021, and at least 7 institutional platforms are actively buying in 2026.
Which private equity platforms are actively consolidating auto repair shops?
Apex tier (national, $1B+ revenue or 1,000+ locations)
Mavis Tire Express Services, Sponsors: BayPine LP (lead), TSG Consumer Partners (partner), Golden Gate Capital (minority since 2021), West First Management. Scale: 1,100+ service centers across 27 states before its 2025 Midas acquisition; the deal added approximately 1,200 Midas locations across the U.S. and Canada. Brand family now includes Mavis Discount Tire, Mavis Tires & Brakes, Midas, Express Oil Change & Tire Engineers, Brakes Plus, Tire Kingdom, NTB, Town Fair Tire, and Tuffy. The platform is the most aggressive consolidator in tire-and-mechanical. BayPine acquisition announcement | Mavis completes Midas acquisition.
Sun Auto Tire & Service, Sponsor: Leonard Green & Partners (majority since September 2021); Greenbriar Equity Group (minority, retained). Scale: 350+ retail locations across the southwestern United States, offering tire replacement, brake repair, alignment, A/C, exhaust, and oil changes. Same sponsor stable as Caliber Collision; Leonard Green is one of the most experienced auto-aftermarket investors. Leonard Green acquisition (Tire Business) | Greenbriar portfolio page.
Growth tier ($250M-$1B revenue or 250-1,000 locations)
Big Brand Tire & Service, Sponsor: Percheron Capital (since 2021); $1.625B recapitalization in 2025 co-led by Blue Owl Capital, ICONIQ, and Warburg Pincus. Scale: 250+ retail stores; sixth-largest independent tire dealership in the United States (2025 MTD 100). Stated goal: quadruple store count over five years. Per Percheron, since their 2021 investment the company has grown revenue more than 10x and profitability more than 15x. Percheron Capital announcement | PR Newswire $1.625B recap.
Christian Brothers Automotive, Sponsor: Roark Capital portfolio brand. Scale: 310+ locations across 30 states at end of 2024; opened 24 new shops in 2025, executed 52 LOIs, welcomed 15 new franchisees, and entered Las Vegas and Reno markets (32nd state). Six-time J.D. Power #1 in Customer Satisfaction among Aftermarket Full-Service Maintenance and Repair Providers. Franchise model, not direct ownership; relevant to the tracker because Roark uses it as a platform-level holding. Christian Brothers 2025 expansion announcement. The full list of automotive repair franchises covers the active buyers, fee structures, and unit-economics for each.
Public-company / strategic tier (relevant as comparables)
Driven Brands Holdings (NASDAQ: DRVN), Public company, 4,200+ locations across the U.S. and Canada, ~$1.9B annual revenue, $6.1B system-wide sales (FY2025). Take 5 Oil Change is the growth flagship: 1,200+ locations, 16% FY24 revenue growth, 7% FY24 same-store sales growth, and 18 consecutive quarters of same-store sales growth through Q2 2025. Divested U.S. car wash to Whistle Express for $385M in early 2025 to focus on Take 5. CARSTAR (~755 franchise units), Maaco, Meineke, Auto Glass Now, and 1-800-Radiator round out the brand family. Driven Brands (NASDAQ: DRVN) FY25 financials.
Monro Inc. (NASDAQ: MNRO), Public company, 1,260 locations, second-largest automotive services company in North America by store count. FY25 revenue approximately $1.2B. Important context: Q4 FY25 sales declined 4.9% YoY; in May 2025 Monro announced the closure of 145 underperforming stores. Listed here as a comparable, not as an active acquirer in 2026. Operating brands include Monro, Mr. Tire, Tread Quarters, Autotire, Ken Towery’s, Tire Warehouse, and Tire Barn. Yahoo Finance: Monro 145-store closure announcement.
Specialty / regional tier
Discount Tire / America’s Tire (The Reinalt-Thomas Corporation), Privately held by the Halle family, not PE-backed. Listed here because no auto-tire roll-up map is complete without it: ~1,250 retail locations across 40 U.S. states. As of 2024 they have acquired regional chains opportunistically (e.g., 25 Dunn Tire locations, December 2024). The largest independent tire retailer in the U.S. and the dominant family-held competitor to PE-backed Mavis, Sun Auto, and Big Brand. If you are evaluating buyer fit for a tire shop sale, this is the only non-institutional acquirer at national scale.
How fast are private equity firms acquiring auto repair shops in 2024-2026?
Disclosed major auto repair / aftermarket equity events since 2021 (institutional capital): September 2021 , Leonard Green & Partners acquires majority of Sun Auto Tire from Greenbriar Equity (terms undisclosed). March 2021 , BayPine + TSG Consumer announce acquisition of Mavis Tire Express from Golden Gate Capital (terms undisclosed, deal closed mid-2021). 2021 , Percheron Capital invests in Big Brand Tire. October 2023 , Alpine Investors closes $3.4B single-asset continuation.
Disclosed major auto repair / aftermarket equity events since 2021 (institutional capital):
- September 2021, Leonard Green & Partners acquires majority of Sun Auto Tire from Greenbriar Equity (terms undisclosed).
- March 2021, BayPine + TSG Consumer announce acquisition of Mavis Tire Express from Golden Gate Capital (terms undisclosed, deal closed mid-2021).
- 2021, Percheron Capital invests in Big Brand Tire.
- October 2023, Alpine Investors closes $3.4B single-asset continuation transaction for Apex Service Partners (HVAC/plumbing/electrical, not auto, but a useful precedent for home-and-auto-services platform-build economics). Source: Alpine Investors.
- February 2025, Driven Brands sells U.S. car wash business to Whistle Express for $385M.
- June 2025, Mavis completes acquisition of Midas (1,200+ locations) from TBC Corporation. Source: Tire Business.
- 2025, Percheron Capital closes $1.625B recapitalization of Big Brand Tire co-led by Blue Owl, ICONIQ, and Warburg Pincus.
Note on private equity disclosure norms: Most platform-level auto repair transactions do not disclose enterprise value, EBITDA, or multiples. Where press accounts cite a number, we attribute it to the reporter; where multiples are quoted as ranges they reflect industry-data tier sources (Peak BV, Auxo Capital, Jaken Equities), not specific transactions.
Auto repair M&A: which companies were acquired recently?
Auto repair M&A in 2026 is driven by a handful of private equity backed platforms rolling up independent shops. The most active acquirers are Mavis Tire Express Services (BayPine, TSG Consumer Partners, Golden Gate Capital), Sun Auto Tire & Service (Leonard Green & Partners), Big Brand Tire & Service (Percheron Capital), and Christian Brothers Automotive (Roark Capital), alongside public consolidators Driven Brands and Monro.
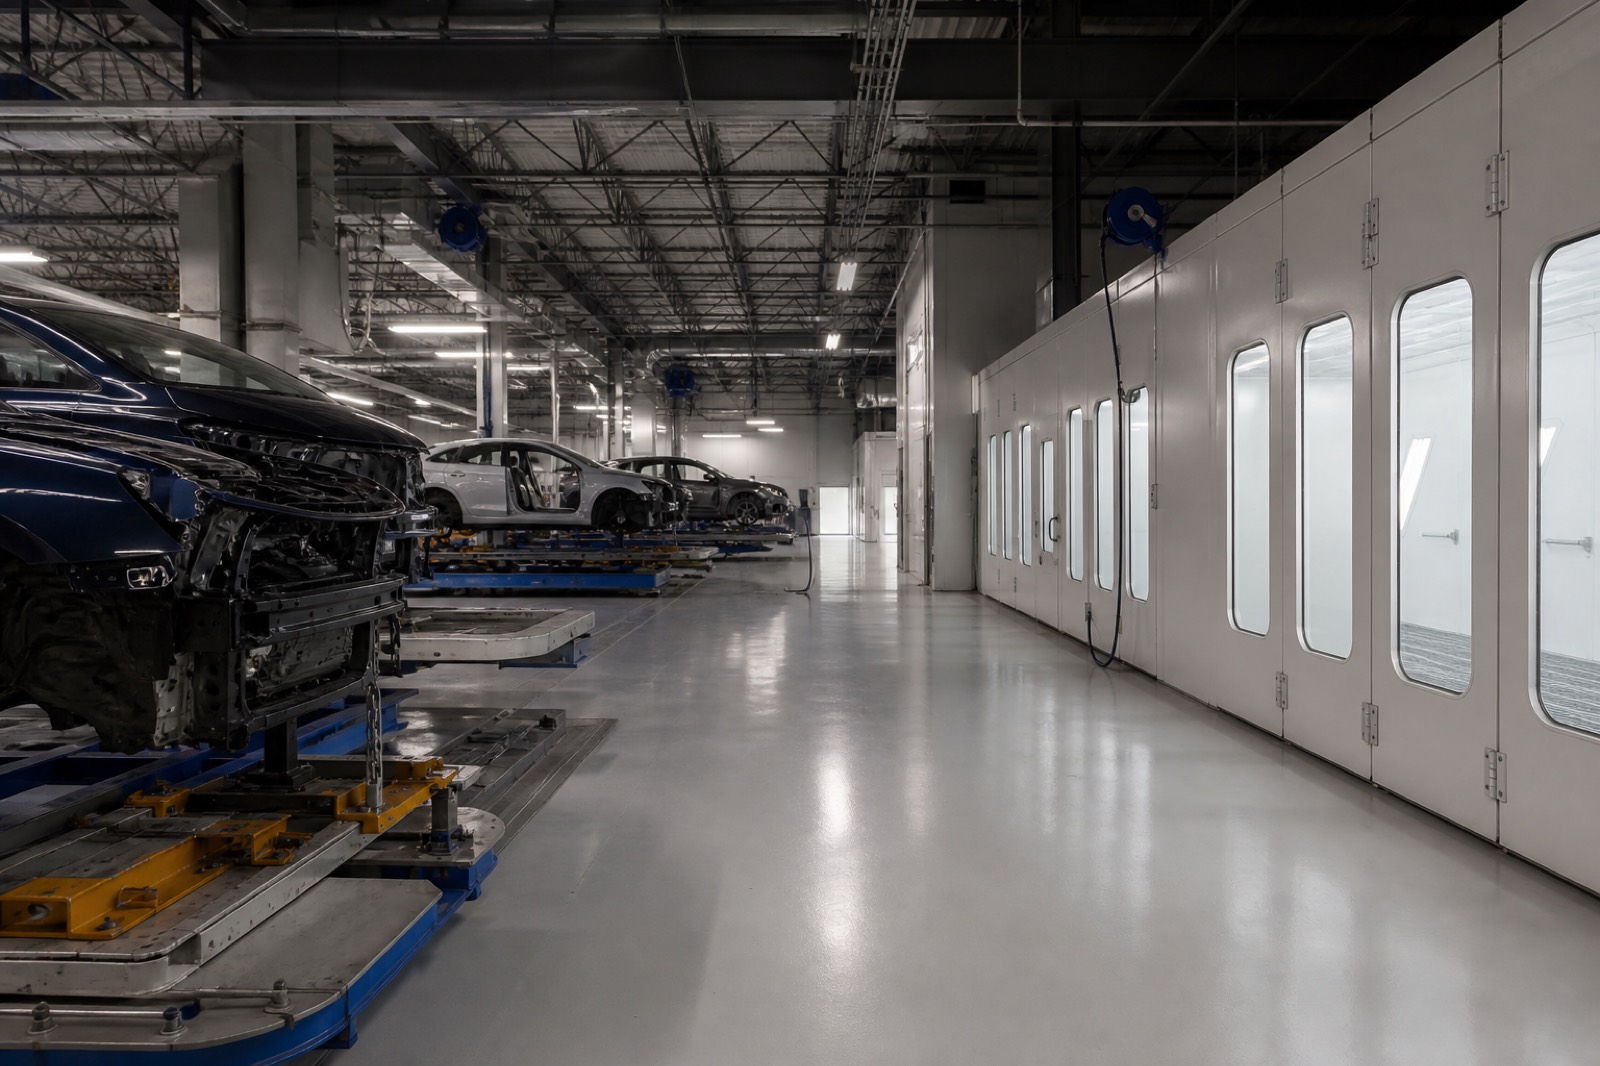
Most auto repair acquisitions never carry a press release. When a platform like Mavis or Sun Auto buys a two to five bay independent, the deal closes privately and the shop is rebranded or folded into an existing region. That is why owners searching for a public list of recently acquired auto repair shops find so little. The consolidation is real, but it happens one tuck-in at a time across the multi-shop operators named above rather than through headline transactions.
The pattern holds across adjacent segments too. Collision repair M&A follows the same roll-up logic, with regional multi-shop operators bought and combined into larger networks that carry insurance direct-repair relationships. Tire and general mechanical shops see the heaviest activity because recurring maintenance revenue and consistent car counts make them the cleanest platforms to build on.
For an owner, the takeaway is that value depends on which buyer you attract. A single-location owner-operator shop typically trades in the low-single-digit SDE range, while a multi-shop operator with clean books and management depth moves into 5x to 6.5x EBITDA territory, per Grata NAICS 8111 and Jaken Equities auto repair valuation data. Platform-eligible groups command more still. If you want to understand how buyers source and price shops like yours, our auto repair acquisition guide walks through exactly how these acquirers find and value independent shops.
Tire shop mergers and acquisitions: who buys tire dealers in 2026
Tire is the most consolidated of the four auto repair rollups, and the buyer list for a tire shop is shorter and more specific than for general repair. Most tire shop M&A in 2026 runs through a handful of national platforms named in the tracker above.
- Mavis Tire Express Services. Backed by BayPine and TSG Consumer Partners, Mavis ran 1,100+ service centers before adding about 1,200 Midas locations from TBC Corporation in June 2025, per Tire Business. It is the most active buyer of tire-and-mechanical shops.
- Sun Auto Tire & Service. Leonard Green & Partners holds the majority of this 350+ location Southwest platform, per the sponsor announcement cited above.
- Big Brand Tire & Service. Percheron Capital’s platform closed a $1.625B recapitalization in 2025, per PR Newswire, and has stated a goal of quadrupling its store count over five years.
- Discount Tire. Family-owned rather than PE-backed, it buys regional chains opportunistically, such as 25 Dunn Tire locations in December 2024, per the tracker above.
Monro, the public comparable, announced the closure of 145 underperforming stores in May 2025, per the announcement cited above, so treat it as a benchmark rather than a likely buyer.
What tire buyers pay for is consistent across these platforms: a mechanical service mix that lifts gross margin, clustered locations that fit an existing market, owned or long-leased real estate, and active OEM dealer agreements. A retail-tire-only shop with no mechanical bays is usually priced as a single-store SDE deal. For multiples by tier and a worked example, see our tire shop business valuation guide. Collision repair has its own buyer set and insurer-driven economics, led by platforms such as Caliber Collision; it is covered in our private equity auto body report.
What multiples and deal structures should auto repair owners expect from PE buyers?
Auto repair valuation breaks cleanly into three operator tiers, each with a different buyer set and multiple range. Buyers who cross over into buying a route-based service business will recognize the same recurring-service math auto repair platforms underwrite.
Auto repair valuation breaks cleanly into three operator tiers, each with a different buyer set and multiple range.
Buyers who cross over into buying a route-based service business will recognize the same recurring-service math auto repair platforms underwrite.
Owner-operator / single-shop tier
Multiple range: 2.0x, 4.5x SDE (Seller’s Discretionary Earnings).
Typical seller: $100K, $400K annual SDE, single location, owner working in the business. Buyer pool: individual operators, SBA-financed strategics, search-fund acquirers, regional consolidators looking for tuck-ins. Premium end (3.5x, 4.5x SDE) requires strong customer retention, modern facility, manageable owner wrench time, transferable management, and an assumable lease (or owned real estate). Source: Peak Business Valuation | Jaken Equities.
Multi-shop operator (MSO) tier
Multiple range: 3.5x, 6.5x EBITDA for the operating business.
Typical seller: $500K, $5M EBITDA, 3, 20 locations, regional brand, professional management in place. Buyer pool: PE-backed national platforms (Mavis, Sun Auto, Big Brand, Christian Brothers, Driven Brands), strategic competitors, and growth-stage PE looking for new platforms. Premium positioning factors: multi-state footprint, OEM certifications (especially for collision-adjacent work), DRP relationships, fleet/B2B mix, owned real estate. Source: Auxo Capital Advisors | Peak Business Valuation.
Platform-eligible tier
Multiple range: 7x, 10x+ EBITDA for platform-quality businesses.
Typical seller: $5M+ EBITDA, 10+ locations, multi-state, scalable systems, professional CFO and CEO, transferable brand. Buyer pool: middle-market and upper-middle-market PE looking for a new platform investment (not an add-on). Platform-eligibility premiums reflect (a) the platform owner role for the next sponsor’s roll-up build, (b) scarcity (only a handful of independent MSOs in the U.S. clear this bar), and (c) the “second bite of the apple” option through rollover equity. Industry-data sources rarely publish this tier because individual transactions are private; the 7x-10x band reflects CT Acquisitions’ active-buyer underwriting in 2024-2026 and is consistent with the Percheron / Leonard Green / BayPine deal economics where they have been disclosed.
Real estate is a separate question
Owned real estate is almost always valued separately at a cap rate (typically 6.5%, 8.5% for general retail/service properties, 5.5%, 7% for high-traffic urban locations with strong demographics). Most PE buyers prefer a sale-leaseback or a separate real estate transaction to a triple-net REIT (Realty Income, STORE Capital, Spirit Realty Capital). This often adds 10%, 25% to total exit proceeds beyond the operating-business multiple.
What criteria do PE platforms use to evaluate auto repair acquisition targets?
Location count and state spread. Multi-state footprint compresses to 5.5x+ EBITDA fast. Single-state regional concentration reads as a regional add-on, not a platform. Repeat customer rate. 50%+ repeat ratio is the floor for premium multiples. Tire-replacement and oil-change models have natural recurring cycles; brake and alignment are episode-driven. Technician retention and ASE certification mix. Buyers underwrite the leadership and senior-technician bench, not just the EBITDA. High turnover or single-technician dependency.
- Location count and state spread. Multi-state footprint compresses to 5.5x+ EBITDA fast. Single-state regional concentration reads as a regional add-on, not a platform.
- Repeat customer rate. 50%+ repeat ratio is the floor for premium multiples. Tire-replacement and oil-change models have natural recurring cycles; brake and alignment are episode-driven.
- Technician retention and ASE certification mix. Buyers underwrite the leadership and senior-technician bench, not just the EBITDA. High turnover or single-technician dependency are diligence-killers.
- Fleet and B2B revenue. Commercial fleet contracts (typically 20%, 40% of revenue at premium operators) compress multiples up. Single-source fleet dependency (one customer >15% of revenue) compresses them down.
- DRP / insurance relationships (for combined mechanical + collision shops). DRP contracts with major insurers (State Farm, GEICO, Progressive, Allstate, USAA) are a multi-million-dollar valuation lever; see the collision-specific tracker for detail.
- Real estate ownership or long lease. 15+ years remaining on assumable leases, or owned real estate with a clean sale-leaseback structure, expand the buyer pool. Short leases or related-party landlord arrangements with no formal terms are common diligence blockers.
- Financial systems. A real shop-management system (Tekmetric, Shop-Ware, R.O. Writer, Mitchell 1) plus a separate accounting system (QuickBooks Enterprise minimum; NetSuite or Sage Intacct preferred above $25M revenue) with monthly close inside 15 days is the floor for institutional buyers.
Recent developments: 2026 status of the major auto services platforms
Mavis Tire has not filed for or priced an IPO as of September 2026. Reporting confirms Mavis is weighing a US listing and has lined up banks for a potential offering of roughly $2 billion, but no S-1 or pricing is public, so the IPO is preparatory, not launched. The platform stays controlled by BayPine, TSG Consumer Partners, Golden Gate Capital (minority), and founding-family vehicle West First Management.
Mavis Tire: IPO preparation and the Pep Boys acquisition
Mavis is preparing for a possible IPO, not executing one. Mavis was reported to be weighing a US IPO in mid-February 2026. Source: Bloomberg, February 13, 2026. It then selected underwriters, including Bank of America, Goldman Sachs, Jefferies, JPMorgan, and Morgan Stanley, for a potential offering that could raise about $2 billion. Source: Bloomberg, February 20, 2026. No SEC registration statement or IPO price had been disclosed as of the last public reporting, so any listing date or valuation is unconfirmed.
Mavis closed its acquisition of Pep Boys. Mavis agreed to buy Pep Boys from Icahn Enterprises for $700 million in cash, announced July 20, 2026. Source: Business Wire, July 20, 2026. The deal completed effective August 20, 2026, moving roughly 800 Pep Boys service and tire locations to a Mavis affiliate while Icahn Enterprises kept the real estate. Source: Modern Tire Dealer, August 2026. Mavis put its combined network above 4,400 locations after closing. Source: Tire Review, July 2026. This is separate from the Midas acquisition covered above.
Sun Auto Tire and Service: still buying under Leonard Green
Sun Auto stayed an active tuck-in acquirer through 2026. The platform completed 37 new openings during 2025 and acquired seven Vannoy’s Tires locations near Pensacola, Florida in October 2025. Source: PrivSource, 2025. Its most recent disclosed deal was the buyout of Highland Tire and Auto Service in Tennessee on June 9, 2026. Source: PitchBook, 2026. Leonard Green and Partners holds the majority stake, Greenbriar Equity a minority position.
Les Schwab: owner exploring a sale above $7 billion
Les Schwab is not a roll-up sponsor platform, but its owner is running a sale process. Meritage Group, which bought Les Schwab from the founding family in 2020, is exploring a sale that could value the roughly 540-store chain at more than $7 billion including debt, and has engaged Goldman Sachs. Source: Reuters via Tire Business, November 2025. No buyer or closing has been announced, so the outcome is unconfirmed.
New private equity entrant: Bertram Capital and Left Lane Auto
Bertram Capital entered as a new institutional sponsor. Bertram invested in Left Lane Auto, a tire and automotive-service platform of more than 75 locations across 18 states, in December 2025. Source: PR Newswire, December 2025. Left Lane then acquired Don Foshay’s Discount Tire and Alignment, a six-store Maine chain, in February 2026. Source: PR Newswire, February 2026.
What this means for auto repair owners considering an exit
Three operator-tier strategies, in order of typical exit value: Sponsors and family offices can submit a CT vetted-buyer intake to receive off-market auto repair opportunities before they list. If you are a single-shop owner-operator , your realistic exit is 2.5x, 4.0x SDE plus real estate (separately, at cap-rate value). Pre-sale prep over 18, 24 months focused on owner-extraction, financial-systems cleanup, technician retention, and a recurring-revenue program (oil change subscriptions, maintenance.
Three operator-tier strategies, in order of typical exit value:
Sponsors and family offices can submit a CT vetted-buyer intake to receive off-market auto repair opportunities before they list.
- If you are a single-shop owner-operator, your realistic exit is 2.5x, 4.0x SDE plus real estate (separately, at cap-rate value). Pre-sale prep over 18, 24 months focused on owner-extraction, financial-systems cleanup, technician retention, and a recurring-revenue program (oil change subscriptions, maintenance plans) can push you from the bottom of the range to the top.
- If you are a 3-20 location MSO, your realistic exit is 4x, 6.5x EBITDA from PE-backed national platforms or growth-stage PE. The key levers between 4x and 6.5x are multi-state footprint, professional management depth, real-estate quality, and customer-concentration scrubbing. Build a 12-month pre-sale plan with a sell-side QofE provider and a real M&A advisor; the auto repair M&A market is sufficiently active that broker-led processes (without a real advisor) are leaving 0.5x-1.5x of EBITDA on the table.
- If you are platform-eligible ($5M+ EBITDA, multi-state, 10+ locations), your realistic exit is 7x, 10x+ EBITDA from middle-market PE, with rollover equity for a meaningful second exit in 3, 5 years. The marketing strategy is closer to a corporate-development sale than a standard auction; the buyer universe is small (maybe 25 institutional acquirers genuinely capable of underwriting a $50M+ platform deal in auto repair), and the right buyer fit matters more than peak headline multiple.
CT Acquisitions runs a buy-side advisory; we represent the buyer universe profiled above. If you are considering an exit, the Owner’s Exit Checklist and Selling to PE guides cover the process end-to-end.
Limitations of this analysis
Platform-level financial terms are typically private. Most disclosed transactions in auto repair report neither enterprise value, EBITDA, nor multiple. The 7x, 10x+ platform-tier range reflects industry-data sources and CT Acquisitions’ active-engagement underwriting; it does not reflect a specific named transaction. Industry-data tier multiples are aggregated. Peak Business Valuation and Auxo Capital Advisors publish blended ranges across regional differences, vehicle-mix differences, and customer-mix differences that we collapse here.

- Platform-level financial terms are typically private. Most disclosed transactions in auto repair report neither enterprise value, EBITDA, nor multiple. The 7x, 10x+ platform-tier range reflects industry-data sources and CT Acquisitions’ active-engagement underwriting; it does not reflect a specific named transaction.
- Industry-data tier multiples are aggregated. Peak Business Valuation and Auxo Capital Advisors publish blended ranges across regional differences, vehicle-mix differences, and customer-mix differences that we collapse here. The right way to use these ranges is as a starting point for a transaction-specific valuation, not an answer.
- Subscription-gated figures are labeled. Where we cite IBISWorld market sizing or GF Data multi-band multiples, the underlying report is paywalled; we cite the publisher but cannot quote the full report.
- Christian Brothers Automotive is a franchise model. We include it because Roark Capital underwrites it at the platform level, but unit-level economics work differently from the company-owned MSOs (Mavis, Sun Auto, Big Brand). Owner-operators considering a franchise exit should consult the franchise’s resale process before this tracker.
- Boyd Group is profiled separately in the auto body / collision tracker because its core US footprint (Gerber Collision, plus the January 2026 acquisition of Joe Hudson’s Collision Center) is collision-focused, not mechanical.
- Discount Tire / The Reinalt-Thomas Corporation is family-held, not PE-backed. We include it because it is the largest non-institutional acquirer in tire and is relevant buyer-archetype context.
- Monro Inc.’s 145-store 2025 closure reflects portfolio rationalization, not an exit from the M&A landscape, but it does mean Monro is not an active acquirer in 2026.
- This tracker focuses on mechanical / tire / quick-lube. Auto body / collision is structurally different (insurance-mediated, DRP-driven, separate sponsor stable) and gets its own tracker.
Future updates and methodology notes
Refresh cadence: quarterly. Refresh triggers (any of): A new institutional sponsor enters the U.S. auto repair platform space (new platform inclusion). An existing platform is recapitalized, sold to a strategic, or files for IPO (status change). An existing platform exits the active-acquirer posture for two consecutive quarters (removal review). Industry-data tier sources publish a new annual multiples report (multiples reconciliation).
Refresh cadence: quarterly. Refresh triggers (any of):
- A new institutional sponsor enters the U.S. auto repair platform space (new platform inclusion).
- An existing platform is recapitalized, sold to a strategic, or files for IPO (status change).
- An existing platform exits the active-acquirer posture for two consecutive quarters (removal review).
- Industry-data tier sources publish a new annual multiples report (multiples reconciliation).
How to flag corrections: Every named platform on this page is sourced to a primary press release, SEC filing, or sponsor portfolio page. If you believe a sponsor attribution, scale figure, or transaction date is wrong, the fastest path to a correction is an email to [email protected] with the primary source (press release URL or SEC filing) that contradicts what we have published. We re-verify and patch within 5 business days.
What this tracker does not do: We do not publish private-deal pricing without primary-source attribution, we do not name buyers in active CT engagements, and we do not produce projections about future multiples or platform behavior.
Related research
Private Equity in Auto Body and Collision Repair 2026 , the companion tracker for the insurance-mediated side of the industry. Auto Repair Shop Valuation , the operator-facing valuation deep-dive (single-shop and multi-shop). How to Sell an Auto Repair Shop , the sell-side process guide for mechanical operators. Lower Middle Market Buyer Mandate Report 2026 , 500+ active U.S. acquirers profiled across home and auto services. Owner’s Exit Checklist , 24-item.
- Private Equity in Auto Body and Collision Repair 2026, the companion tracker for the insurance-mediated side of the industry.
- Auto Repair Shop Valuation, the operator-facing valuation deep-dive (single-shop and multi-shop).
- How to Sell an Auto Repair Shop, the sell-side process guide for mechanical operators.
- Lower Middle Market Buyer Mandate Report 2026, 500+ active U.S. acquirers profiled across home and auto services.
- Owner’s Exit Checklist, 24-item pre-sale preparation framework.
Sources and references
Every named platform, sponsor, and scale figure on this page is sourced to a primary press release, SEC filing, or sponsor portfolio page. Industry-data tier (multiples, market size) draws on the named industry research publishers. Subscription-gated figures are labeled in body where used. BayPine announcement of Mavis Tire acquisition (with TSG Consumer) , Mavis platform sponsor structure Tire Business: Mavis completes Midas acquisition , June 2025 Midas integration (1,200+ locations).
Every named platform, sponsor, and scale figure on this page is sourced to a primary press release, SEC filing, or sponsor portfolio page. Industry-data tier (multiples, market size) draws on the named industry research publishers. Subscription-gated figures are labeled in body where used.
- BayPine announcement of Mavis Tire acquisition (with TSG Consumer), Mavis platform sponsor structure
- Tire Business: Mavis completes Midas acquisition, June 2025 Midas integration (1,200+ locations)
- Tire Business: Leonard Green acquires Sun Auto Tire, Sun Auto sponsor transition (Sept 2021)
- Greenbriar Equity portfolio: Sun Auto Tire & Service, minority retention by Greenbriar
- Percheron Capital: Big Brand Tire $1.625B recapitalization, 2025 recap details
- PR Newswire: Percheron Big Brand Tire $1.625B recap, co-investor structure (Blue Owl, ICONIQ, Warburg Pincus)
- PR Newswire: Christian Brothers Automotive 2025 franchise expansion, Roark Capital portfolio platform scale
- Driven Brands (NASDAQ: DRVN) FY2025 financials (StockAnalysis), Take 5 / CARSTAR / Maaco / Meineke scale and growth
- Monro Inc. (NASDAQ: MNRO) FY2025 financials (StockAnalysis) + Yahoo Finance: 145-store closure, 1,260 location footprint, 145-store closure announcement
- Peak Business Valuation: Automotive Repair Valuation Multiples, SDE 2.0x-4.5x, EBITDA 3.5x-6.5x ranges
- Auxo Capital Advisors: Auto Repair & Collision EBITDA Multiples, mid-market 3.5x-6.5x EBITDA cross-check
- Jaken Equities: Auto Repair Shop Valuation, SDE/EBITDA framework for owner-operator tier
- Grata: NAICS 8111 Automotive Repair and Maintenance Market Overview, ~70% independent share, 50 largest firms generate <10% of revenue
- IBISWorld: NAICS 811111 General Automotive Repair, subscription-gated industry sizing reference
- GF Data, subscription-gated LMM EBITDA multiples by deal size band
- Axial: EBITDA Multiples by Industry (lower-middle-market benchmark synthesis), small-business / SDE transaction medians
- CT Acquisitions Roll-Up Tracker series, plumbing, roofing, pest control, dental DSO, manufacturing, companion methodology and verification standards.
Last verified: May 24, 2026. Next refresh: quarterly.
Disclaimer: This tracker is general market intelligence, not investment, legal, or tax advice. Multiples and outcomes by operator tier are illustrative; actuals vary with deal structure, geography, and buyer fit. CT Acquisitions is a buy-side advisor; we represent acquirers and may have active engagements with platforms profiled here.