How to Prepare Your Restoration Business for Exit in 2026: The 36-Month PE-Buyer Playbook
Preparing your restoration business for exit in 2026 is a 36-month playbook. The first 12 months tighten the operating story around TPA panel placement, recurring insurance-carrier work, and IICRC certification depth. The middle 12 fix pre-LOI diligence gaps around technician retention, equipment fleet condition, and hurricane/storm-cycle revenue normalization. The final 12 turn one offer into a real competitive process. Named consolidators include ATI Restoration (Audax), BluSky, Servpro, First Onsite.
Exiting your restoration business is the single largest financial event most owners will ever face. This guide is the no-fluff playbook for restoration business owners who are 12-36 months from sale, covering how PE-backed buyers actually value your business in 2026, the 12 levers that move your multiple, pre-LOI diligence, deal-killers to fix before going to market, and the full 36-month exit prep timeline.
Updated June 25, 2026 · CT Acquisitions

Most property restoration owners decide to sell, hire a broker, and find out 90 days later that their business is worth 30% to 40% less than they thought. The owners who get the top-quartile price start preparing 24 to 36 months before they ever talk to a buyer. This guide is the 36-month playbook for water, fire, mold, and biohazard restoration owners 6 to 36 months from a private equity or strategic exit. It covers what private equity actually buys in restoration, the 12 levers that move multiples, the documents PE will ask for before they send an indication of interest, and the deal-killers that re-trade restoration transactions during confirmatory diligence. Every number cites its source. Every recommendation comes from how the most active restoration buyers in 2026 actually behave.
TL;DR: What restoration owners must do BEFORE going to market
- Start 24 to 36 months out. The owners getting top-quartile multiples begin to prepare their restoration business for sale 2-3 years pre-exit. A 6-month rush typically leaves 20-35% of enterprise value on the table.
- Get IICRC certifications documented firm-wide. WRT + ASD + AMRT + FSRT spread across 5+ technicians. Master designations cannot be concentrated on the owner.
- Sign 3+ TPA program contracts in writing (Crawford Contractor Connection, Sedgwick Repair Solutions, Alacrity, Accuserve, CoreLogic Next Gear). Non-exclusive caps the multiple at 5-6x EBITDA; preferred or exclusive moves it to 7-10x.
- Get a sell-side Quality of Earnings (QoE) done first. $35K-$75K investment typically supports a 1x multiple uplift on $5M EBITDA = $5M of incremental sale price.
- Cap CAT mix under 20%, get owner out of estimating and supplements, and shift to a 15-25% recurring program revenue layer (multi-family, hotels, REITs).
If you are 6 to 36 months from a possible exit, this is the work that turns a 5x EBITDA outcome into an 8x to 10x EBITDA outcome. (For an instant ballpark before reading further, run the numbers through our restoration business valuation tool.) On a $3M EBITDA restoration business, that is the difference between a $15M sale and a $24M to $30M sale. Whether you want to prepare your restoration business for sale to private equity, prepare your restoration business for an exit to a strategic acquirer such as BluSky or BELFOR, or simply maximize value over the next 1 to 3 years before going to market, the work below applies. Restoration is one of the hottest PE consolidation lanes in the 2024 to 2026 cycle, and the third-party administrator (TPA) and insurance program relationships that drive your premium are also what take 18 to 24 months to build correctly.
Building toward an exit in 12 to 36 months?
CT Acquisitions runs sell-side advisory for restoration owners $1M+ EBITDA across water, fire, mold, and biohazard service lines. We also have restoration operations specialists in our partner network who run pre-sale optimization engagements when the timeline is longer. No fee to you on buy-side introductions; sell-side mandates are paid on success at closing.
What Private Equity Actually Buys in Restoration (2026)
Restoration is the hottest PE consolidation lane in the property services world right now. (CT Acquisitions maintains a live restoration disaster recovery PE roll-up tracker with every deal in the 2024-2026 cycle.) PE has deployed $6B+ across 50+ restoration platforms since 2018, with 49+ new PE-backed acquisitions since September 2023 alone (Pestakeholder.org, 2024). 2024 restoration M&A transaction volume hit ~138 deals, up 32% year over year, with 50+ deals already in H1 2025 (The Deal Sheet, 2026). The sponsor money flowing in is not random. PE buys specific profiles, and the profile you build determines the multiple you get.
The PE-attractive restoration profile
- EBITDA threshold for a platform-quality deal: $2M EBITDA is the institutional cutoff (Beechwood Capital Advisors, 2022; YourExitValue, 2026). Below $2M, you are an add-on inside a roll-up or a franchise platform target. $2M to $10M is the bolt-on sweet spot for the major consolidators. $10M to $25M+ EBITDA puts you in platform-candidate territory at 8x to 11x or higher.
- TPA and carrier program participation: Enrolment in 3+ TPA programs (Crawford Contractor Connection, Sedgwick Repair Solutions, Alacrity, CoreLogic Next Gear, Accuserve) and preferred contractor designation with 1 to 3 major carriers (State Farm, Allstate, USAA, Farmers, Nationwide). Non-exclusive caps the multiple at 5x to 6x EBITDA; preferred or exclusive with 2 to 3 carriers at $2M+ each moves the band to 7x to 10x (YourExitValue, 2026).
- Service breadth: Full-service (mitigation + reconstruction + contents + mold) earns a +25% to +35% multiple uplift over single-line operators (YourExitValue, 2026).
- CAT (catastrophe) mix: Less than 15% to 20% of revenue from catastrophe chasing. Companies above 30% CAT “struggle with valuations and buyer interest” (Cleanfax State of the Industry, 2024).
- Carrier and customer concentration: No single carrier above 10% to 15% of revenue. Top 5 carriers below 40%. Concentration above 20% triggers buyer pushback; above 25% triggers a 15% to 30% valuation discount or buyer withdrawal (Beancount.io, 2026; Morgan & Westfield; Strategex).
- Geography: Texas, Florida, North Carolina, South Carolina, Georgia, California, Arizona, the mid-Atlantic, and the broader hurricane corridor concentrate 2026 sponsor demand. Stranded or single-metro low-disaster geographies discount.
- IICRC certification depth and owner role: Multiple IICRC Master Water Restorer designations across the firm, not just the owner. Owner is in management, not running estimates or supplement disputes. GM in place 12+ months pre-sale.
Active restoration PE platforms in 2026
The list below covers the most active sponsor-backed restoration platforms in the 2024 to 2026 cycle. This is who will see your teaser. Add-on counts are point-in-time; sources include Pestakeholder.org, PrivSource, Tracxn, Cleanfax, R&R Magazine, FirstService Form 40-F filings, and individual sponsor press releases.
| Platform | Sponsor | Profile |
|---|---|---|
| BluSky Restoration Contractors | Partners Group + Kohlberg & Company (Oct 2021) | 900+ employees, 40+ branches, 5,000+ customers at acquisition; estimated $1B+ EV; national commercial, industrial, healthcare, multifamily; $1M to $10M EBITDA add-ons |
| BELFOR Holdings | American Securities (control); Goldman Sachs >25% non-voting economic interest (filed 2024) | 14,000+ professionals across 34 countries; global leader; Nordic SSG Group acquired Dec 2024; $3M to $25M+ add-ons |
| SERVPRO Industries | Blackstone Core PE (March 2019 majority recap, $1B+ per WSJ) | 2,300+ US franchises; +295 units over 3 years; Entrepreneur Franchise 500 #12 in 2026; franchise + corporate |
| ATI Restoration | TSG Consumer Partners (August 2020 minority; Moore family retained majority) | 15 acquisitions Nov 2020 to April 2024; 70+ locations coast to coast; $2M to $15M add-ons |
| First Onsite / Paul Davis Restoration | FirstService Corporation (NASDAQ: FSV) | 330+ Paul Davis locations; FY2024 $212.2M and FY2025 $107.2M aggregate initial cash consideration on FirstService acquisitions; national; $3M to $25M |
| HighGround Restoration Group | Knox Lane (recapped from Trivest, March 11, 2025) | 13 add-ons under Trivest; 12x revenue growth; 700 employees; 13 states at exit; national residential water/fire |
| American Restoration Holdings | Morgan Stanley Capital Partners (July 25, 2024, from Soundcore) | 8 acquisitions / 20 locations / 10 states under Soundcore; Rocky Mountain Catastrophe added Nov 2024; Dallas HQ |
| Cotton Holdings | Sullivan Brothers Family of Companies (Oct 28, 2025, from Sun Capital) | Cotton GDS, Cotton Roofing, Cotton Logistics, Stellar Commercial Roofing, Full Circle, Advance Catastrophe Technologies; $20B commercial restoration market; Houston HQ |
| BMS CAT / Blackmon Mooring | AEA Investors (Sept 30, 2019) | 12 acquisitions cumulative; Legacy Services Corp Dec 2024; national commercial + residential; $1M to $10M |
| Guardian Restoration Partners | Alpine Investors (launched April 2024) | 14 acquisitions in first ~18 months; DryLux + Dry Kings + Midwest Restoration founders; AZ, SF Bay, WI start; $1M to $5M |
| Insurcomm / Rytech (Fortify Companies) | Summit Partners | Insurcomm added Theraclean (NJ) Nov 2024 and Soil-Away (NH); Rytech adds 100+ franchises in 25 states; combined 30+ states |
| Right Restoration Partners | Percheron Capital ($3B+ AUM; launched Oct 30, 2024) | New platform; CEO Rob Comstock (ex Service Experts); Atlanta HQ; Southwest + Northeast start |
| Restoration Alliance | Hidden River Strategic Capital + Taurus Capital (Jan 6, 2025) | New platform from ServiceMaster Restore franchisee; Sorenson family operator; Seattle-Tacoma; Pacific NW start |
| Liberty Restoration Group | MBN Brands + Petra Capital + SharpVue (April 2025) | New platform from two ServiceMaster Restore franchisees in 5 states; St. Louis HQ |
| Endurant Disaster Recovery | Compass Group Equity Partners (May 28, 2025) | New platform combining Parker Young Restoration (Atlanta, 1986) + McCabe Restoration (Memphis, 1994); ~150 employees; SE US |
| Rewind Restoration | LP First Capital + Align Collaborate (Nov 12, 2025) | New platform; Icon Restoration (Rochester Hills MI, 80+ employees) is initial investment; Michigan start |
| INTACT Property Restoration | West Edge Partners (Dec 2023) | Flood Response (CA) + Valley Restoration (ID); Western US; $1M to $5M |
| RUI Holdings (Atlas Restoration Specialists) | Great Range Capital (KS) | 7 acquisitions cumulative; integrated staffing (One Source Staffing); Midwest, St. Louis; $1M to $5M |
| Dayspring Restoration | Trinity Hunt Partners (Dec 2020) | Western US; Missoula MT base; $1M to $5M |
| Restoration Systems (RSI) | Blue Point Capital Partners (April 24, 2025 recap) | Building envelope (facade, parking) restoration; Minneapolis + Milwaukee; double-digit growth pre-deal; Midwest commercial |
| DRYmedic Restoration | Authority Brands (Apax Partners + BCI minority) | 17 new owners / 26 territories in 2024; 16 deals / 25 territories in 2025; national via franchise |
| Rainbow International Restoration | Neighborly (KKR) | 330+ Rainbow Restoration franchise locations in North America; Neighborly’s 19 brands / 5,000+ locations; national via franchise |
| PuroClean | Mark Davis + Frank Torre (100% owners since Oct 2019; sister Signal Restoration since 2012) | ~500 franchise locations; national via franchise + Signal corporate |
| DKI (Disaster Kleenup International) | Gemini Holdings (historically); cooperative network structure | 400+ independent contractors at 215+ locations; North America network model |
| SERVPRO West Coast DRT | Orangewood Partners (Jan 2024 strategic investment) | Single large SERVPRO franchisee; West Coast |
Add to that list the strategic acquirers. BELFOR, BluSky, FirstService (First Onsite + Paul Davis), SERVPRO Industries, and ATI Restoration are the strategic-platform buyers most active across the 2024 to 2026 cycle. FirstService Q3 2024 Brands-segment revenue hit $836.5M (+44% YoY); the April 14, 2026 Paul Davis Cleveland/Akron acquisition disclosed $6,379K cash consideration on a single franchise (FirstService Form 6-K). Insurance carriers themselves have not directly acquired a US restoration platform in 2024 to 2026 per public filings; carriers instead route claim volume through Direct Repair Programs and TPAs (Crawford Contractor Connection, Sedgwick Repair Solutions, Alacrity, CoreLogic Next Gear, Accuserve, BlueTeam). State Farm, Allstate, Farmers, and USAA run internal preferred-contractor programs; getting in is the moat.
Restoration Valuation Multiples in 2026 (What You Are Actually Worth)
The multiple a buyer pays comes down to your size, your service mix, your TPA and carrier program participation, your CAT concentration, and your geographic fit. (For the deeper drill-down on how buyers weight insurance-work revenue vs. retail revenue in the valuation cut, see the dedicated breakdown.) Here is the 2026 range, cross-referenced from Peak Business Valuation, YourExitValue, The Deal Sheet, Beechwood Capital Advisors, and CT Acquisitions’ own restoration PE map.
SDE multiples (smaller, owner-operated, sub-$1M SDE)
| SDE band | SDE multiple | Source |
|---|---|---|
| Under $500K SDE | ~2.8x SDE | The Deal Sheet 2026 |
| $500K to $1M SDE | ~3.0x SDE | The Deal Sheet 2026 |
| $1M to $2M SDE | 2.3x to 3.6x SDE | The Deal Sheet 2026 |
| Restoration blended SDE range | 2.34x to 3.55x SDE; average 2.98x | Peak Business Valuation 2026 |
| Restoration revenue multiple | 0.47x to 0.93x revenue; average 0.67x | Peak Business Valuation 2026 |
EBITDA multiples (PE-attractive size)
| EBITDA band | Multiple range | Profile fit |
|---|---|---|
| Sub-$2M EBITDA, undifferentiated | 3.24x to 4.31x EBITDA average | Below institutional cutoff; franchise platform or small strategic buyer (Peak Business Valuation 2026) |
| $2M to $5M EBITDA, mid-market | 4.0x to 7.0x EBITDA | With carrier and TPA relationships (The Deal Sheet 2026; YourExitValue 2026) |
| $5M to $10M EBITDA | 5.0x to 8.5x EBITDA | Sponsor-backed bolt-on (YourExitValue 2026; The Deal Sheet 2026) |
| $10M to $25M EBITDA (platform candidate) | 8.0x to 11.0x EBITDA | 8.5x to 10.0x most common closed range (The Deal Sheet 2026) |
| Platform tier ($25M+ EBITDA) | 11x to 18x EBITDA | Implied by HighGround/Knox Lane (March 2025); American Restoration/MSCP (July 2024); historical comps |
Layered on top of size, the buyer type sets the band. National franchise platforms (BELFOR, FirstService, Authority Brands, Neighborly) pay 7x to 10x EBITDA; PE-backed consolidators (BluSky, ATI, Guardian, HighGround successor) pay 6x to 8.5x; insurance-aligned service companies pay 5.5x to 7.5x; experienced strategic regional sub-platform buyers pay 5x to 6.5x (YourExitValue, 2026). The $2M EBITDA threshold is the institutional cutoff. Below that, you are selling to a smaller strategic or franchise platform, not a sponsor-backed roll-up (Beechwood Capital Advisors, 2022).
Recent disclosed restoration transactions (2024 to 2026)
| Acquirer | Target | Date | Value / Detail |
|---|---|---|---|
| Sullivan Brothers Family of Companies | Cotton Holdings (from Sun Capital) | Oct 28, 2025 | Terms not disclosed; Cotton operates in $20B US commercial restoration market with 7 subsidiary brands |
| Knox Lane | HighGround Restoration Group (from Trivest) | March 11, 2025 | Terms not disclosed; 13 add-ons in 5 years, 12x revenue growth, 700 employees, 13 states under Trivest |
| Morgan Stanley Capital Partners | American Restoration (from Soundcore) | July 25, 2024 | Terms not disclosed; 8 acquisitions / 20 locations / 10 states under Soundcore; MSCP’s 5th services investment |
| FirstService Corporation | Paul Davis Restoration Cleveland/Akron OH franchise | April 14, 2026 | $6,379K cash consideration disclosed (FirstService Form 6-K) |
| Compass Group Equity Partners | Parker Young + McCabe Restoration (form Endurant) | May 28, 2025 | ~150 combined employees; SE US |
| LP First Capital + Align Collaborate | Icon Restoration (form Rewind Restoration) | Nov 12, 2025 | 80+ employees; Rochester Hills MI |
| Blue Point Capital Partners | Restoration Systems (RSI) recap | April 24, 2025 | Building envelope restoration, Minneapolis + Milwaukee; double-digit growth pre-deal |
| FirstService Corporation | FY2024 acquisitions (8 businesses, 6 in FirstService Brands) | FY2024 | $212.2M total initial cash consideration (Form 40-F) |
| FirstService Corporation | FY2025 acquisitions (9 businesses, 7 in FirstService Brands) | FY2025 | $107.2M total initial cash consideration (Form 40-F) |
Sources: Cotton Holdings press release and PR Newswire (Oct 28, 2025); Trivest, Knox Lane, and Harris Williams press releases (March 2025); Morgan Stanley Capital Partners press release and Soundcore press release (July 2024); FirstService Form 6-K (April 2026) and Form 40-F (FY2024 and FY2025); Compass Group Equity Partners press release (May 28, 2025); LP First Capital and PR Newswire (Nov 12, 2025); Blue Point Capital Partners and Business Wire (April 24, 2025).
The 12 Value Levers That Move Your Multiple (Ranked by Impact)

These are the levers that move restoration multiples in the 24 months before a sale. Each one has a current state, a target state, and an estimated financial impact. The ordering is by dollar impact per unit of effort, based on cross-source synthesis from YourExitValue, The Deal Sheet, ATI Restoration’s M&A playbook, R&R Magazine’s 2025 exit guide, Cleanfax, Pushleads, Beechwood Capital Advisors, and Morgan & Westfield.
Lever 1: Lock in TPA, DRP, and preferred contractor relationships
Current: Local agent referrals; 0 to 1 TPA program; no carrier preferred-contractor designation. Target: Enrolled in 3+ TPA programs (Crawford Contractor Connection, Sedgwick Repair Solutions, Alacrity or Accuserve, CoreLogic Next Gear); preferred or exclusive on at least one major carrier (State Farm, Allstate, USAA, Farmers, Nationwide) with $2M+ annual program revenue; documented KPI performance on cycle time, cost containment, and CSAT. Impact: Non-exclusive caps the multiple at 5x to 6x EBITDA. Preferred or exclusive with 2 to 3 carriers at $2M+ each moves the band to 7x to 10x EBITDA (YourExitValue, 2026). On a $3M EBITDA shop, that is the difference between a $15M to $18M sale and a $21M to $30M sale. This is the single largest lever in the restoration vertical. How: TPA enrolment takes 30 to 180 days per program (Diginebel, 2024). Begin 18 to 24 months before going to market. Crawford’s Contractor Connection has 6,000+ vetted contractors and requires a 5-year workmanship warranty. Build the KPI scorecard. Lock in the carrier preferred-contractor designation by passing each carrier’s onboarding gates (financials, EMR, IICRC certifications, response time, CSAT).
Lever 2: Shift mix toward water mitigation and away from CAT chasing
Current: Heavy reconstruction emphasis (60%+ recon); CAT chasing 30%+ of revenue. Target: Mitigation 40% to 60% of revenue (70% to 80% gross margin); reconstruction 25% to 35% (30% to 45% gross margin); CAT under 15% to 20% of total revenue. Impact: Mitigation gross margin runs 70% to 80%; fire 50% to 65%; mold 55% to 70%; reconstruction 30% to 45% (Pushleads, 2026). A blended margin lift of 5 to 10 points on a $5M revenue shop equals $250K to $500K of incremental EBITDA. At a 7x multiple that is $1.75M to $3.5M of sale price. Buyers preferring under 15% to 20% CAT mix is a hard rule across PE diligence (ATI Restoration M&A Playbook; R&R Magazine, 2025). Companies generating 30%+ from CAT struggle with valuations (Cleanfax, 2024). How: Sales-team comp on mitigation conversion; technician comp on emergency response speed; capacity allocation away from low-margin CAT chase; build the local program-work pipeline that does not require a hurricane.
Lever 3: Build a recurring or program revenue layer
Current: 100% one-off insurance and retail jobs. Target: 15% to 25% of revenue from large-account commercial programs, preventive maintenance contracts (multi-family operators such as Greystar or AvalonBay, hospitals, hotels, school districts, REITs), post-mitigation monitoring programs. Impact: Estimate +0.5x to 1.0x multiple uplift. On $3M EBITDA at a 7x baseline that is $1.5M to $3M of additional sale price. Recurring and program revenue is the single most cited multiple-expansion driver across PE buyer commentary. How: Build a National Accounts team. Target multi-family operators, hotel management companies, healthcare systems, and hospitality REITs. Bundle preventive water-leak detection and quarterly inspection into a fixed-fee annual contract. Build a contents-storage facility for ongoing client overflow.
Lever 4: Move the owner out of estimating and supplements
Current: Owner writes every Xactimate estimate, handles every supplement dispute with the carrier, signs every contract above $25K, is the relationship at the top 3 carriers. Target: GM in place 12+ months; 2 to 3 senior estimators handle all but the top 10% by ticket; an in-house estimating manager or sublet to a service like Empire Estimators or Pride Estimating handles peak load; owner does under 30 hours per week and is on vacation for 2 weeks without a phone call. Impact: Owner dependence is the most-cited multiple haircut across restoration valuation literature (R&R Magazine, 2025; ATI Restoration M&A Playbook; YourExitValue, 2026). On a $1M to $3M EBITDA business, removing key-person risk moves the multiple from the 4x to 5x band into the 6x to 7x band, worth $1M to $6M of price (estimate, synthesis). How: GM hire 18 to 24 months pre-sale (typical restoration GM comp $150K to $250K + bonus). Document SOPs for water cat-1, cat-2, cat-3, fire, smoke, mold, biohazard. Build a leadership scorecard. Transition top carrier relationships to a National Accounts director.
Lever 5: Run a real monthly close on Dash, Albi, Encircle, and Xactimate
Current: QuickBooks + spreadsheets, no service-line P&L, KPIs anecdotal, photos and supplements in disparate folders. Target: Dash by Next Gear (Cotality) or Albi as the system of record; Xactimate + Xactanalysis integrated; Encircle for field documentation; monthly close within 15 days; KPI dashboard covering average ticket by service line, jobs per tech per week, equipment utilization, DSO by carrier, supplement realization rate, and CSAT. Impact: Estimate +0.25x to 0.75x multiple. The bigger story is that platform PE buyers will require migration to Dash (the carrier-integrated standard) within the first 12 months post-close anyway; having it pre-close removes an execution risk and lets the buyer underwrite EBITDA at a higher multiple. How: Budget $25K to $100K implementation; choose Dash if you do volume with TPAs (Albiware calls it the “800-pound gorilla” with carrier integrations), Albi if your operation is leaner and you want a modern UX with a 4.5 Capterra rating vs. Dash 2.9. Force tech adoption with payroll-tied job-completion compliance.
Lever 6: Push average ticket and supplement discipline
Current: Average water mit ticket $2,500 to $3,500; fire $10K to $15K; supplement capture under 50% of opportunity; supplements written by owner only. Target: Average water mit $3,200 to $8,500; average fire $15K to $50K (per Pushleads, 2026 benchmarks); supplement capture above 70% of identified opportunity. Impact: “Insurance scope of loss is written for 50% to 65% of what it should be, meaning 35% to 50% opportunity for the contractor to be paid what is rightfully owed” (Restoration AI; QuickPay Claims). On a $5M shop with 60% insurance revenue, a 20-point supplement-capture improvement equals $300K to $500K of incremental revenue, with most flowing to EBITDA. At a 7x multiple that is $2.1M to $3.5M of price. How: Train a dedicated supplement specialist (or outsource to Empire / Pride / Catalyst-style services); build the scope-and-supplement SOP; document with photos, measurements, and line-by-line Xactimate logic; pursue every supplement above $1,500 with the carrier adjuster.
Lever 7: De-concentrate carrier exposure
Current: Top carrier above 20% of revenue (often State Farm or USAA when sourcing through a strong single DRP). Target: Top carrier under 10% to 15%; top 5 carriers under 40%. Impact: Concentration above 20% triggers a 15% to 30% valuation discount; above 25% can trigger buyer walk (Beancount.io, 2026; Wall Street Prep; Morgan & Westfield; Strategex). On a $20M revenue shop, every percentage point of top-customer concentration above 20% is roughly 0.05x to 0.1x of EBITDA multiple at risk (estimate). The bigger and stickier the carrier relationship, the worse the lock-in risk if the carrier reorganizes its DRP panel or migrates to a different TPA. How: Enrol in a second and third TPA program; diversify into commercial program revenue (multi-family, hotels, healthcare); expand the geographic footprint so no single carrier dominates because of a single metro.
Lever 8: Build IICRC certification depth across the firm
Current: 1 or 2 WRT-certified techs; no AMRT (mold) or FSRT (fire/smoke); owner is the only IICRC Master. Target: Full slate (WRT, ASD, AMRT, FSRT, OCT, CCMT) across 5+ field staff; multiple IICRC Master designations; firm-level certification for IICRC vendor-program pre-approval. Impact: TPA vendor program prerequisite. “You MUST have WRT, ASD, and AMRT to be considered a professional in today’s water mitigation industry” (Accuserve, 2024). Estimate +0.25x to 0.75x EBITDA from certification depth alone, primarily because each certification step opens up a new TPA enrolment and reduces key-person risk on the master designation. How: Budget $1,500 to $3,000 per certification; classroom + hands-on time. Pay for techs to attend and tie pay raises to certifications. Stop relying on the owner as the only IICRC Master.
Lever 9: Bring reconstruction in-house with a W-2 crew
Current: 100% of reconstruction subbed to outside GCs; mitigation in-house, recon outsourced; client experience varies. Target: 50%+ of reconstruction in-house with W-2 crews; named superintendent on every job above $25K; documented job-cost system. Impact: Captures 30% to 45% reconstruction gross margin in-house (Pushleads, 2026) instead of losing it to the sub. On a $4M reconstruction revenue stream, a 50-point in-house lift captures roughly $400K to $700K of incremental gross profit, of which $200K to $400K flows to EBITDA. At a 7x multiple that is $1.4M to $2.8M of sale price. The buyer also values the recon team as a moat of trained labor. How: Hire a recon superintendent; build a W-2 carpentry + drywall crew; standardize a job-cost system inside Dash or Albi. Watch the W-2 vs. 1099 classification: misclassifying recon crews is one of the top kill items in restoration confirmatory DD.
Lever 10: EBITDA add-back hygiene and clean owner books
Current: Owner mixes personal expenses through the business with no documentation; related-party rent at above-FMV (or below-FMV); no add-back schedule. Target: Every potential add-back documented as it happens with the underlying invoice; related-party rent restruck to FMV with appraisal; clean payroll for owner-family members; written rationale for above-market owner comp tied to GM replacement market rate ($150K to $250K for a restoration GM with carrier-relationship sales overlay). Impact: Every defensible dollar of adjusted EBITDA gets multiplied. On a 7x multiple, $100K of clean add-backs equals $700K of sale price (Morgan & Westfield QoE guide). How: Adopt a monthly add-back log starting today. Document the business purpose of every charge. Get an FMV market-rent appraisal if the owner owns the operating real estate. Quantify and label any large CAT-event revenue separately so the buyer cannot quietly normalize it down without rebuttal.
Lever 11: Working capital normalization (the restoration twist)
Current: A/R seasonally swings between 60 and 120 days outstanding by carrier; WIP balances surge after every major loss; deferred revenue on prepaid programs not isolated; supplements take 90+ days to collect. Target: TTM-average working capital is stable; A/R by carrier tracked and aged; supplement DSO under 60 days; deferred revenue isolated on the balance sheet. Impact: The working capital peg is set off TTM average. A volatile A/R pattern lets the buyer set a higher peg, which subtracts from purchase price. Estimate: poorly managed working capital costs 2% to 5% of enterprise value (cross-vertical norm; BDO; Morgan & Westfield). How: Carrier-by-carrier A/R follow-up. Supplement specialist who closes loops within 30 days. Isolate prepaid maintenance liability on the balance sheet. Buyers will discount A/R over 90 days by 25% to 50% in the working capital calculation if you let them.
Lever 12: Compliance scrub across the restoration regulatory stack
Current: Florida mold remediator license in owner’s name only; Texas contractor license tied to owner; EPA RRP firm and individual certifications expired; OSHA 1910.1030 written bloodborne pathogen exposure control plan missing; no respiratory protection program; no W-2/1099 audit trail. Target: Mold remediator license held by multiple individuals across the firm and substantiated for endorsement (Florida allows licensure by endorsement after 10 years out of state, per MyFloridaLicense.com); entity-level CGC/CBC (Florida) with named qualifier and succession plan; EPA RRP firm cert current (5-year cycle, $300 fee) plus individual certified renovators (5-year cycle, 8-hour initial + 4-hour refresher); OSHA 1910.1030 bloodborne pathogens written exposure control plan with annual training; EPA Section 608 records if dehumidifier or HVAC adjacency; OSHA 1910.132 PPE hazard assessments on file; OSHA 1910.134 respiratory protection program for mold and biohazard work. Impact: Each item can kill or re-trade the deal at confirmatory diligence. Civil penalty exposure under RRP runs up to $49,772 per violation per day as of January 2025 (EPA, TSCA penalty schedule). Real cases: Logan Square $2M lead abatement + $400K penalty; Indiana operator 16-month federal prison sentence for knowing RRP violation plus obstruction. How: Cover this in months 24 to 12 of the run-up, before the QoE.
Want to grow your business to maximize value before exiting?
We connect restoration owners with operations specialists in our partner network who run 12 to 24 month pre-sale optimization engagements. TPA enrolment alone is an 18 to 24 month project that compounds into 1 to 3 turns of EBITDA multiple at sale. The engagement pays for itself many times over in incremental sale price.
What PE Asks Before They Send an LOI (The Pre-LOI Diligence Stack)
Before a PE firm commits to a letter of intent, they ask for a focused diligence package. The list below is the real pre-LOI ask from a 2026 PE firm targeting a restoration business in CT Acquisitions’ pipeline. The “why” and “how to prepare” expand each item to what is typical across the industry.
1. Income statements for 2024, 2025, and the latest trailing twelve months
Why PE asks: They are building the LTM EBITDA they will multiply. They want trend (revenue and margin trajectory), seasonality (storm patterns drive Q3 and Q4 spikes), and one-time movers (large CAT-job revenue, the hurricane-driven Q3 2024 spike, and the hurricane-free 2025 Atlantic season trough that softened restoration revenues regionally per FirstService Q3 2025 commentary).
How to prepare: Accrual-basis monthly P&L, service-line view (mitigation / reconstruction / mold / contents / commercial program). Tie to tax returns. Flag and separately quantify any CAT-event revenue line so the buyer can normalize on a defensible basis, not their own.
2. Balance sheet at the latest month
Why PE asks: Working capital peg and net debt sizing. Restoration has unusually large work-in-process (open job files, unbilled supplements awaiting carrier approval) and large A/R balances tied to insurance carrier cycle times.
How to prepare: Tie to the trial balance. Separately disclose aged A/R (with carrier cycle time), unbilled WIP, customer deposits (debt-like), capital lease balances on equipment and trucks, deferred revenue on prepaid programs.
3. Adjusted EBITDA and add-back schedule
Why PE asks: They want their own normalized EBITDA before deploying QoE budget. If add-backs are aggressive or undocumented, they discount all your numbers.
How to prepare: Document each add-back with the underlying invoice or payroll record. Restoration add-backs that hold up: above-market owner comp (delta to GM replacement market rate, typically $150K to $250K); one-time legal fees from insurance bad-faith litigation; owner family-member payroll; owner vehicle and personal travel; owner health insurance and country-club; one-time IT and FSM software conversion; one-time CAT-related staffing surge; related-party rent at above-FMV (delta back to FMV); ERC. Large CAT events (a $4M hurricane-driven job) are often normalized down by buyers as not run-rate; manage that narrative pre-LOI rather than letting the buyer write it.
4. Anonymized employee roster (titles, start dates, pay, classification)
Why PE asks: Three risks. (a) Technician retention and depth (the IICRC-certified workforce is the moat). (b) Owner dependence (is the CEO also the sales lead and the lead estimator?). (c) Classification risk (W-2 vs. 1099 for reconstruction subs and helpers; construction is one of the highest US misclassification rates per DOL).
How to prepare: Roster columns include role, hire date, FT/PT, W-2 vs. 1099 with classification rationale, comp structure, IICRC certs (WRT, ASD, AMRT, FSRT, IICRC Master), EPA RRP if applicable, valid driver’s license, OSHA training, and non-compete or non-solicit status. Pull rolling 12 and 24 month tech retention; sub-25% turnover is industry rule-of-thumb, above 35% is a red flag.
5. Revenue breakdown by service line and customer type
Why PE asks: This single exhibit tells them mitigation vs. reconstruction mix (mitigation runs 70% to 80% GM, reconstruction 30% to 45% GM per Pushleads, 2026), insurance vs. retail mix, top-10 carrier concentration, and CAT-event share.
How to prepare: For 2023, 2024, 2025, and LTM provide: revenue by service line (water mit, fire mit, mold, contents, reconstruction, commercial program), job count and average ticket by line, insurance vs. retail vs. commercial, CAT vs. non-CAT, top-10 carrier concentration with annual revenue, average DSO by carrier. Benchmark average ticket: water mit $3,200 to $8,500; fire $15,000 to $50,000; mold $2,000 to $8,000; reconstruction $10,000 to $75,000 (Pushleads, 2026). Average insurance claim cycle for water damage runs $11K to $14K per industry data.
6. Insurance, TPA, and carrier program status
Why PE asks: This is the restoration equivalent of the recurring-revenue exhibit in other verticals. The bigger and stickier the program participation, the higher the multiple. TPA enrolment takes 30 to 180 days (Diginebel, 2024) and is a hard moat.
How to prepare: List of every Direct Repair Program or Preferred Contractor designation (State Farm Premier Service, Allstate Good Hands, USAA, Farmers, Nationwide, MetLife). List of every TPA enrolment (Crawford Contractor Connection, Sedgwick Repair Solutions, Alacrity, CoreLogic Next Gear, Accuserve, BlueTeam network). For each: enrolment date, geographic coverage, year-over-year volume, KPI performance (cycle time, cost containment, CSAT). Provide your CSAT and warranty record (Contractor Connection requires 5-year workmanship warranty per Crawford). Flag any disputes, suspensions, or warnings.
7. Five-year business plan
Why PE asks: They underwrite their own forward case; your plan tells them how aggressive you are and whether you understand your levers.
How to prepare: Operating model with revenue by service line, gross margin by service line, opex growth, EBITDA, and CapEx. Include planned TPA enrolments, geographic expansion, and commercial program pipeline. Be conservative on hurricane-year revenue: a 2024-style CAT season is not the run rate.
8. Equipment fleet and trucks list
Why PE asks: Restoration is equipment-intensive. The $500K to $1.5M of specialized equipment benchmark (YourExitValue, 2026) covers air movers, dehumidifiers (LGR and desiccant), HEPA air scrubbers, hydroxyl and ozone machines, negative-air containment, moisture meters and thermal imagers, generators, drying chambers, content cleaning rigs. PE wants replacement CapEx forecast, capital lease and financed equipment (debt-like at close), and brand condition for future rebrand.
How to prepare: Spreadsheet with asset ID, type, brand, year, condition, ownership (owned / financed / leased), monthly payment, residual. Truck list with VIN, make/model/year, mileage, wrap status, DOT and tag status. Flag any truck with title issues or expired DOT.
9. Licensing and certification roster
Why PE asks: State-level transferability. Florida mold remediator licenses, Texas contractor licenses, California CSLB classifications, and IICRC Master credentials are tied to individuals, not entities. If those individuals are the owner or owner-family, the deal needs a transition plan.
How to prepare: Entity license list (every state of operation, every classification including general contractor, mold remediator, asbestos abatement, lead/RRP, biohazard) + individual license list (qualifier, master plumber if applicable, IICRC certs, EPA 608/RRP, OSHA 10/30).
10. Outstanding insurance carrier disputes and bad-faith litigation
Why PE asks: Restoration is one of the most litigated service verticals because of the Florida AOB era and supplement-driven disputes nationally. A pending bad-faith suit against a major carrier can scare the buyer.
How to prepare: Schedule of litigation and threatened claims with status. For Florida operators: any AOB-era exposure pre-Jan 1, 2023 (SB 2-A killed AOB on new policies effective then). Schedule of supplement disputes above $50K and outcomes.
Confirmatory Diligence (After You Sign the LOI)
Once an LOI is signed and exclusivity starts (typically 45 to 90 days per Colonnade Advisors podcast 020), the buyer runs parallel workstreams. This is the depth of inspection your business will undergo. If anything was hiding, it surfaces here.
- Quality of Earnings (QoE). Outside accounting firm runs revenue cut-off testing, recognition timing on long-cycle insurance jobs (estimate billings vs. final scope), supplement realization, deferred revenue on prepaid programs, add-back validation, working capital trends. Buy-side QoE cost for restoration: $50K to $250K for $1M to $10M EBITDA. Output: an adjusted EBITDA number the buyer locks into the model.
- Customer, carrier, and TPA concentration. Carrier-by-carrier and TPA-by-TPA revenue analysis; cycle time and cost-containment KPIs by carrier; CSAT scores; warranty exposure. Calls to top TPAs and carrier program managers to validate standing and forward volume.
- IT and field-systems audit. Dash by Next Gear (Cotality), Albi, Encircle, Xactimate, Xactanalysis, Symbility, MICA, DocuSketch. PE platforms increasingly standardize on Dash and Xactimate because they integrate with carrier and TPA workflows. Data quality, photo documentation completeness, sketch-to-estimate flow, supplement audit trail.
- Legal. Entity good standing in every operating state; licenses (mold, asbestos, lead/RRP, general contractor); contracts (TPA program agreements, carrier MSAs, customer/job contracts, equipment leases, truck leases, real estate leases); assignment-of-benefits exposure (Florida pre-Jan 1, 2023 policies; PA Act 48 contractor exposure); IP; litigation history (active and threatened, including insurance carrier bad-faith); warranty and callback liability (5-year minimum for Contractor Connection contractors).
- HR and Payroll. W-2 vs. 1099 classification audit. The DOL flags construction as one of the highest-misclassification industries; restoration reconstruction crews are a frequent audit target. I-9 compliance; wage-and-hour (overtime classification for night and weekend CAT work); benefits; PTO; OSHA logs; any pending EEOC, DOL, or SS-8 claims; non-compete enforceability in operating states.
- Environmental and OSHA. Refrigerant handling records if you do dehumidifier or HVAC adjacencies (EPA Section 608); RRP records and certified-firm renewals (EPA Lead RRP); asbestos abatement licensing per state; mold-remediation licensing per state; biohazard cleanup OSHA 29 CFR 1910.1030 written exposure control plan; hazardous waste manifests; OSHA 1910.134 respiratory protection program; any UST or vehicle-shop environmental exposure on owned real estate (Phase I ESA on any owned property).
- Insurance. General liability, professional liability (errors-and-omissions for estimating disputes), workers comp with EMR (many large projects require sub-0.85 EMR per Vertikal RMS, 2026), commercial auto, pollution liability (mold and biohazard), umbrella, surety bond capacity.
- Tax. Federal income; payroll; sales/use tax in states where restoration services are taxable (Texas non-residential repair and maintenance is taxable; Pennsylvania repair and maintenance is taxable in many situations); property; franchise and excise.
Why You Should Pay for Your Own Quality of Earnings Before Going to Market
A sell-side Quality of Earnings (QoE) report is your own outside accountant’s QoE, paid for by you, before going to market. It does three things in restoration: pre-empts the buyer’s QoE by getting to the adjusted EBITDA number first, with documentation; surfaces issues you can fix pre-market (W-2/1099 misclassification on recon crews, sales/use tax exposure in TX and PA, AOB pre-2023 exposure in FL, supplements aged above 180 days, customer concentration); and tightens the EBITDA number you take to market, which directly drives the headline price. Restoration is uniquely add-back-heavy (above-market owner comp, large CAT-event normalization, supplements outstanding, related-party rent, family payroll) and uniquely revenue-recognition-heavy (long-cycle insurance jobs with estimate billings, supplements written months after job close, deferred revenue on prepaid programs). All of those are easier to fix on your timeline than on the buyer’s.
Cost
- $25K to $35K for QoE if revenue is below $10M (cross-vertical lower-middle-market norm; Eton Venture Services, 2025; Morgan & Westfield).
- $35K to $75K typical for sell-side QoE on a healthy restoration business with multiple service lines and TPA-driven revenue (synthesis from Eton, 2025; Kahn Litwin Renza, 2025; Midstreet).
- Up to $150K for businesses with multiple entities, complex add-backs, AOB-era Florida exposure, or messy books (Eton, 2025).
ROI
Industry example used across QoE provider content: a $25M revenue, $5M EBITDA business. Moving the multiple from 5x to 6x equals $5M of additional sale price. A $50K QoE investment that supports the 1x lift is a 100x return (Eton, “Quality of Earnings Report Cost”, 2025). Restoration-specific example: a $4.5M revenue restoration business in the southeast presented at $850K SDE in seller financials. The QoE re-cut for one-time large hurricane job revenue and overstated add-backs landed at $620K adjusted EBITDA. Better to fix that pre-market than to have the buyer write the bridge during confirmatory diligence (estimate, synthesized from EBIT Community QoE patterns and YourExitValue case studies, including the Rapid Response Restoration of Dallas case that moved from $980K pre-improvement valuation to $1.4M post-improvement valuation, with $420K of value added through 3 new TPA programs and expanded service capability).
Deal-Killers That Re-Trade Restoration Transactions (Avoid These)
These are the recurring kill-shots cited across restoration M&A advisory content and confirmatory diligence. Most of them are fixable in 12 to 24 months. None of them are fixable in 30 days.
1. CAT revenue concentration above 20% to 30%
Companies generating 30%+ from catastrophe work struggle with valuations and buyer interest (Cleanfax State of the Industry, 2024). Buyers want under 15% to 20% CAT mix (ATI Restoration M&A Playbook; R&R Magazine, 2025). CAT-heavy revenue gets normalized down because it is not run-rate; the buyer’s QoE will re-strike LTM EBITDA without the storm year and price the deal off that number. The 2025 hurricane-free Atlantic season (the first since 2015) made this even more pronounced because it exposed which platforms had a real non-CAT engine.
2. Carrier or customer concentration above 20%
Top carrier above 15% triggers buyer pushback; above 20% triggers a 15% to 30% valuation discount; above 25% triggers walk or restructure (Beancount.io, 2026; Strategex; Morgan & Westfield). SBA lenders, who finance many sub-$15M deals, get uncomfortable at 20% (Wall Street Prep, 2025).
3. State licensure tied to the owner
Florida mold remediator licenses are issued to individuals (per MyFloridaLicense). Florida CGC/CBC contractor licenses require an entity qualifier; many restoration shops have the owner as the named qualifier, and the license does not automatically transfer. Texas contractor licenses, California CSLB classifications, similar story. The buyer either finds a new qualifier on day one or restructures the deal.
4. IICRC certification concentration on the owner
If the owner is the only IICRC Master Water Restorer, AMRT (mold) credential holder, or FSRT (fire/smoke) credential holder, the entire firm is a flight risk in confirmatory DD. TPA vendor programs require WRT + ASD + AMRT minimum (Accuserve, “Important IICRC Certifications for Water Damage Mitigation”).
5. W-2 vs. 1099 misclassification on reconstruction crews
Construction (which includes restoration reconstruction) is one of the highest-misclassification industries per the DOL. Restoration shops often run drywall, carpentry, and painting subs as 1099 to dodge payroll tax. IRS penalty exposure runs $10K to $100K+ per misclassified worker once back taxes, penalties, interest, and legal cost are aggregated (Tax1099; ADP SPARK, 2023). DOL and IRS renewed enforcement focus in 2024 to 2025 per multiple compliance bulletins. A single SS-8 filing by a former contractor opens a workforce-wide audit. The IRS Voluntary Classification Settlement Program (VCSP) lets you reclassify going forward with roughly 10% of prior-year employment tax liability and no prior-year audits, and is the path of choice if exposure is identified pre-LOI.
6. EPA RRP (Renovation, Repair and Painting) violations
Civil penalty up to $49,772 per violation per day as of January 2025 (TSCA; EPA Enforcement Alert). Real cases: Logan Square $2M lead abatement + $400K penalty; an Indiana renovator received 16 months federal prison for knowing violation plus obstruction. The most common audit finding is a firm whose RRP firm certification expired (5-year cycle) or whose certified renovators are not on file for jobs done in pre-1978 housing.
7. OSHA 1910.1030 bloodborne pathogen and biohazard exposure
Biohazard cleanup requires a written exposure control plan, annual training, EPA-registered tuberculocidal disinfectants, regulated-waste handling (incinerated or autoclaved), and HBV vaccination offerings (29 CFR 1910.1030; eCFR). Most restoration shops doing biohazard or trauma scene cleanup do not have a current written plan. OSHA’s Severe Violator Enforcement Program (SVEP) places employers with willful or repeated violations on a heightened-inspection list that follows them for years; SVEP status is a deal-killer (OSHA SVEP 2022 expansion).
8. Workers Comp EMR above 1.00
Most general contractors require subcontractor EMR below 1.00; many large commercial projects require below 0.85 for prequalification (Vertikal RMS, 2026; HCSS). A restoration firm targeting commercial program work with EMR above 1.00 has a structural ceiling on the buyer’s growth case. EMR is based on 3 prior years of claim experience, so cleaning it up is a 2-to-3-year project.
9. Sales and use tax exposure in service-revenue states
Texas non-residential repair, maintenance, and installation labor is taxable (Texas Comptroller). Pennsylvania taxes repair, maintenance, and installation on tangible property in many situations (PA DOR Bureau of Audits Sales and Use Tax Manual). Restoration shops frequently under-collect on commercial work. The buyer’s confirmatory tax DD surfaces multi-year exposure that comes out of purchase price as a holdback or escrow.
10. Florida AOB (Assignment of Benefits) exposure pre-Jan 1, 2023
Florida SB 2-A, signed Dec 16, 2022 by Gov. DeSantis, amended Fla. Stat. 627.7152 to eliminate the ability for property owners to assign post-loss insurance benefits to third-party contractors on any homeowner or commercial property policy issued on or after Jan 1, 2023 (Brelly Florida Contractor’s AOB Guide; Chartwell Law SB 2-A; The Florida Senate 2022A bill summary). SB 2-A also eliminated Florida’s one-way attorney fee provision in property insurance statutes. For Florida restoration shops, any open AOB-era claim, supplement dispute, or bad-faith litigation from policies issued before Jan 1, 2023 is a discrete exposure item the buyer will dig into during confirmatory legal DD.
11. Pennsylvania Act 48 (HICPA) contractor exposure
PA Act 48, the Home Improvement Consumer Protection Act, regulates home-improvement contractors, requires registration ($50), and mandates specific disclosures and contract terms. Restoration recon falling under HICPA scope must be in compliance or the contracts are voidable by the homeowner (PA Office of Attorney General). The buyer’s legal DD checks state-by-state contract compliance.
12. Supplement disputes and aged accounts receivable
Restoration supplements are a recurring source of carrier disputes and aged A/R. Supplements above 180 days, multiple write-offs in the trailing year, or open arbitration with a major carrier (especially State Farm or Citizens Property Insurance Corporation in Florida) erode buyer trust in the receivable balance. Many buyers will discount A/R over 90 days by 25% to 50% in the working capital calculation.
The 36-Month Exit Prep Timeline
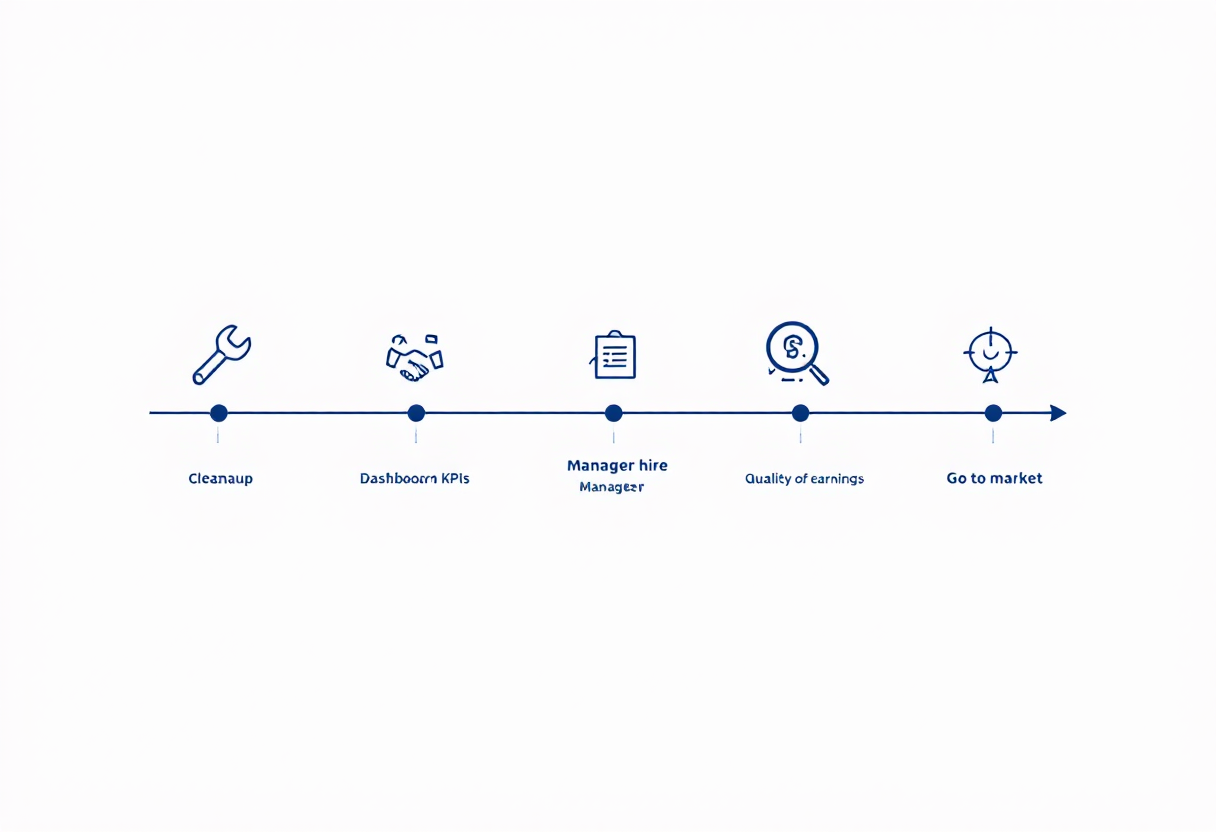
T-36 months: Cleanup phase
- Switch to accrual basis if still on cash basis
- Pick the FSM and migrate (Dash by Next Gear if you do TPA volume; Albi if your operation is leaner)
- Adopt Encircle for field documentation and Xactimate + Xactanalysis for estimating
- Start tagging every potential EBITDA add-back as it happens
- Conduct a W-2 vs. 1099 audit; reclassify if needed (settle exposure via VCSP while it is small)
- Restruck related-party rent to FMV with appraisal
- Build the org chart and identify the GM hire target (internal promotion or external recruit)
- Phase I ESA on any owned real estate
- Sales/use tax compliance review by outside counsel in TX, PA, and any state where you do non-residential work
- Florida operators: scope any open AOB-era claims and supplement disputes from pre-Jan 1, 2023 policies
- EPA RRP firm certification current; individual certified renovators on roster; 5-year retention of records
- OSHA 1910.1030 written bloodborne pathogen exposure control plan; OSHA 1910.132 PPE hazard assessment; OSHA 1910.134 respiratory protection program
- IICRC firm-level certification application; tech-level WRT, ASD, AMRT, and FSRT enrolment plan
T-24 months: Financial discipline, KPI infrastructure, TPA penetration
- GM hire onboarded and starting to take operational load (typical comp $150K to $250K + bonus)
- Monthly close in 15 days; service-line P&L every month (mitigation, fire, mold, contents, reconstruction, program)
- KPI dashboard: average ticket by line, jobs per tech per week, equipment utilization, DSO by carrier, supplement realization rate, CSAT
- Begin enrolment in 2 to 3 TPA programs (Contractor Connection / Sedgwick / Alacrity / Accuserve / CoreLogic Next Gear); 30 to 180 day cycles per program
- Push for preferred-contractor status with 1 to 2 carrier programs (State Farm Premier Service, Allstate Good Hands, USAA, Farmers, Nationwide)
- Pricing review: align Xactimate use, train estimators on options-based presentation, hire supplement specialist
- Begin diversification of carrier base if any top carrier is above 20% of revenue
- Document SOPs for every operational role (water cat-1/2/3, fire, smoke, mold, biohazard, recon)
- Build the add-back bridge as a living document
T-12 months: QoE-ready close discipline, eliminate owner dependence
- Owner steps out of estimating and supplements; GM and supplement specialist run them
- Owner takes a 2-week unplugged vacation as the stress test
- Run the sell-side QoE (budget $35K to $75K)
- Tighten balance sheet: clean A/R by carrier, kill dormant inventory, isolate deferred revenue on prepaid programs
- Final org-chart review; backfill any gaps
- Final compliance scrub (license transferability with named qualifier succession; EPA RRP and Section 608 records; OSHA written plans and training records; W-2/1099 classification; sales/use tax; environmental)
- Lock in 12 months of clean service-line P&L with CAT carve-out for the CIM
T-6 months: Pre-marketing prep
- Engage M&A advisor (restoration-focused: Beechwood Capital Advisors, Brentwood Growth, Midstreet, Auxo Capital Advisors, MBS Advisors, Northborne Partners; Harris Williams, William Blair, or Baird for $25M+ EBITDA platforms)
- Typical advisor fee: $25K to $75K monthly retainer credited against success fee of 4% to 8% of enterprise value, Lehman or modified Lehman scaling
- CIM drafted from the QoE and operating model
- Teaser drafted (anonymized 1-pager)
- Buyer list finalized (minimum 25+ sponsors and strategics from the platforms table above: BluSky, BELFOR, SERVPRO franchise system buyer, ATI Restoration, First Onsite or Paul Davis under FirstService, Cotton Holdings under Sullivan Brothers, BMS CAT / AEA, Knox Lane / HighGround, MSCP / American Restoration, Guardian / Alpine, Insurcomm-Rytech / Summit, Right Restoration / Percheron, Restoration Alliance / Hidden River, Liberty / Petra-SharpVue, Endurant / Compass, Rewind / LP First Capital, INTACT / West Edge, Authority Brands / DRYmedic, Neighborly / Rainbow, Trinity Hunt / Dayspring, Great Range / RUI, plus 3 to 5 strategic regional buyers)
- Virtual data room populated with everything from the pre-LOI and confirmatory sections above
- Management presentation deck built and rehearsed
T-3 months: Go to market
- Teaser distributed; NDAs collected; CIMs distributed
- IOIs collected 2 to 3 weeks after CIM goes out
- Narrow to 4 to 6 finalists for management meetings
- Management meetings; LOIs solicited
- Select LOI; sign with exclusivity (typically 45 to 90 days)
- Enter confirmatory diligence; close
End-to-end from engagement to close: 9 to 12 months in a well-run process (Auxo Capital Advisors sell-side process guide, 2025; Beechwood Capital Advisors, 2022; R&R Magazine, 2025).
Worked Example: $4M EBITDA Mid-Atlantic Restoration Company Prepping for Sale (18-Month Roadmap)
Composite from CT Acquisitions’ restoration pipeline: a Maryland-headquartered water, fire, and mold restoration business doing $18M revenue and $4M adjusted EBITDA in 2025. Two state operating footprint (MD and VA). 65% mitigation / 30% reconstruction / 5% contents. Current TPA enrolment in Crawford Contractor Connection only (non-exclusive). One State Farm preferred-contractor designation in a single metro. Owner is the lead estimator and runs all top-5 carrier relationships. CAT mix ran 22% in 2024 (Hurricane Helene secondary loss work). Below is the realistic 18-month roadmap to move the business from a 6x outcome ($24M EV) to an 8.5x outcome ($34M EV), a $10M swing on a $50K to $200K total prep investment.
Month 1-3: Diagnostic and quick wins
- Engage CT Acquisitions for a pre-engagement diagnostic (free).
- Bring in a sell-side QoE provider for scoping (budget $60K, kickoff month 4).
- Begin Sedgwick Repair Solutions enrolment application (90 to 180 day cycle).
- Begin Alacrity enrolment (60 to 120 day cycle).
- Pull the W-2 vs. 1099 audit on the reconstruction crew (40 carpenters and drywall hangers currently on 1099). Settle exposure via VCSP if needed.
- Sales/use tax review for VA commercial work (commercial repair labor is taxable in VA in many situations).
Month 4-9: GM hire and operational lift
- GM hire onboarded at $215K base + 25% bonus (recruited from a regional BluSky branch).
- Owner transitions out of estimating, hands top-5 carrier relationships to a new National Accounts Director ($140K + commission).
- Sell-side QoE delivered, locking adjusted EBITDA at $4.05M with documented add-back bridge.
- Sedgwick enrolment approved; Alacrity enrolment approved; pursue Accuserve as third TPA.
- State Farm preferred-contractor designation expanded to second metro.
- IICRC firm-level certification application filed; 6 new techs sit for WRT + ASD + AMRT.
- FSM migration from QuickBooks-plus-spreadsheets to Dash by Next Gear ($65K implementation).
Month 10-15: Multiple-expansion proof points
- Three TPA programs enrolled + State Farm preferred status in two metros = the carrier-relationship moat is now documented.
- Two large commercial program wins: a regional hotel REIT (4 properties, $400K annualized) and a multi-family operator (12 properties, $750K annualized). Recurring program revenue layer now at 6% of total revenue, tracking to 15% by close.
- CAT mix engineered down to 14% by shifting capacity to local mitigation calls.
- Owner has taken a 2-week unplugged vacation; GM ran daily operations without issue.
- Monthly close in 12 days, full service-line P&L by month with carrier-level AR aging.
Month 16-18: Go to market
- CT Acquisitions runs the sell-side process. CIM and teaser drafted from the QoE.
- Buyer list: 25+ sponsors (Knox Lane, MSCP, Compass Group, Alpine, Summit, Percheron, Hidden River, LP First Capital, West Edge, Great Range) + 8 strategics (BluSky, BELFOR, ATI, First Onsite, Cotton, SERVPRO regional, BMS CAT, HighGround).
- IOIs collected; 6 finalists invited to management meetings.
- 3 LOIs received in the 7x to 9.2x EBITDA range. Selected an 8.5x LOI from a sponsor-backed bolt-on.
- Confirmatory diligence runs 75 days; deal closes at $34.4M enterprise value, with 70% cash, 20% rollover equity in the platform, and 10% earnout tied to year-1 EBITDA hold.
Total investment in the prep: roughly $185K (QoE $60K, GM and Director recruiting $25K, Dash migration $65K, TPA enrolment and certification costs $25K, IICRC certifications $10K). Total uplift in enterprise value vs. selling 18 months prior at a 6x outcome: ~$10M. ROI: 54x on the prep investment, ignoring the additional rollover-equity upside on the 20% retained stake.
Frequently Asked Questions
How long should I plan for before selling my restoration business to a private equity buyer?
The owners who get top-quartile pricing start preparing 24 to 36 months before going to market. The minimum useful prep window is 12 months, because most of the highest-impact levers (enrolling in 2 to 3 TPA programs, installing a GM, getting on Dash or Albi, running a sell-side QoE, building IICRC certification depth across the firm) need 12+ months of clean trailing-twelve-months data to be credible to a buyer. TPA program enrolment alone takes 30 to 180 days per program (Diginebel, 2024), and earning preferred-contractor status with a major carrier can take 18 months. Owners who try to sell in under 6 months typically leave 20% to 35% of enterprise value on the table.
What is a realistic EBITDA multiple for a $2M EBITDA restoration business?
$2M EBITDA is the institutional cutoff for sponsor-backed roll-ups (Beechwood Capital Advisors, 2022). At that level the range is 4x to 7x EBITDA. The bottom applies to demand-only shops with no TPA enrolment, no carrier preferred-contractor designation, heavy CAT-chasing revenue mix, owner-dependence, and concentrated customer base. The top applies to shops with 3+ TPA program enrolments, preferred-contractor status with at least one major carrier, mitigation-heavy mix under 15% CAT, a GM in place, and customer concentration under 10% (The Deal Sheet, 2026; YourExitValue, 2026). National franchise platforms (BELFOR, FirstService, Authority Brands, Neighborly) sit at the top of that band at 7x to 10x; PE-backed consolidators come in at 6x to 8.5x; experienced regional strategics at 5x to 6.5x. The 36-month prep playbook moves you from the bottom of the band to the top.
Should I get a Quality of Earnings report done before going to market?
For restoration businesses at $1M+ EBITDA, yes. A sell-side QoE costs $35K to $75K typical, up to $150K for complex situations involving multiple entities, AOB-era Florida exposure, or messy books (Eton Venture Services, 2025). The ROI math is straightforward. If your QoE supports a 1x multiple uplift on a $5M EBITDA business at a 6x baseline, that is $5M of additional sale price for a $50K investment. More importantly, a pre-market QoE surfaces restoration-specific issues (W-2/1099 misclassification on reconstruction crews, large CAT-event normalization, supplements aged above 180 days, deferred revenue on prepaid programs, Florida AOB exposure) while you can still fix them, rather than during exclusivity when the buyer re-trades the deal.
How much does TPA program participation (Crawford, Sedgwick, Alacrity, Accuserve) actually add to my valuation?
It is the single largest lever in restoration valuation. Non-exclusive TPA enrolment caps the multiple at 5x to 6x EBITDA. Preferred or exclusive status with 2 to 3 major carriers at $2M+ annual program revenue each moves the band to 7x to 10x EBITDA (YourExitValue, 2026). On a $3M EBITDA shop, that is the difference between a $15M to $18M sale and a $21M to $30M sale, or up to $15M of incremental enterprise value. The mechanics: TPA enrolment cycles run 30 to 180 days per program (Diginebel, 2024); Crawford Contractor Connection has 6,000+ vetted contractors and requires a 5-year workmanship warranty; carrier preferred-contractor onboarding gates include financials, EMR, IICRC certifications, response time, and CSAT performance. Begin 18 to 24 months before going to market.
Do I need to put a general manager in place before I sell?
If your goal is to maximize price, yes, ideally 12+ months pre-sale. Owner dependence is the most-cited multiple haircut across restoration valuation literature (R&R Magazine “Is Now the Time to Exit”, 2025; ATI Restoration M&A Playbook; YourExitValue, 2026). On a $1M to $3M EBITDA restoration business, removing key-person risk moves the multiple from the 4x to 5x band into the 6x to 7x band, worth $1M to $6M of price. A restoration GM hire runs $150K to $250K plus bonus (the wider range vs. trades reflects the carrier-relationship sales overlay) and needs 12 to 18 months to fully take operational load, particularly on Xactimate estimating and supplement-dispute management, before the buyer’s diligence team will believe the transition.
Is CAT (catastrophe) work helping or hurting my exit valuation?
Above 20% of revenue, it is hurting. Companies generating 30%+ from CAT struggle with valuations and buyer interest (Cleanfax State of the Industry, 2024). Buyers want under 15% to 20% CAT mix (ATI Restoration M&A Playbook; R&R Magazine, 2025). The reason is that the buyer’s QoE normalizes LTM EBITDA without the storm year and prices the deal off that lower number. A $4M hurricane job in the trailing twelve months will be re-cut to a run-rate average and the difference comes out of your enterprise value. The 2025 hurricane-free Atlantic season (the first since 2015 per Cleanfax) made this even sharper by exposing which platforms had a real non-CAT engine. If you are CAT-heavy, the 24-month prep work is to build the local program-work pipeline, lock in TPA enrolments, and shift mix toward water mitigation that does not require a storm to generate revenue.
Which private equity firms are the most likely buyers for my restoration business in 2026?
The most active sponsor-backed restoration platforms in the 2024-2026 cycle include BluSky Restoration Contractors (Partners Group + Kohlberg), BELFOR Holdings (American Securities), SERVPRO Industries (Blackstone), ATI Restoration (TSG Consumer Partners), First Onsite and Paul Davis (FirstService), Cotton Holdings (Sullivan Brothers, October 2025), HighGround Restoration Group (Knox Lane, March 2025), American Restoration Holdings (Morgan Stanley Capital Partners, July 2024), BMS CAT (AEA Investors), Guardian Restoration Partners (Alpine Investors), Insurcomm-Rytech (Summit Partners), and Right Restoration Partners (Percheron Capital). For deals above $2M EBITDA expect 25+ sponsors plus strategic acquirers (BELFOR, BluSky, FirstService, SERVPRO, ATI) to see your teaser.
What happens to insurance receivables (AR aging) during a restoration M&A sale?
Insurance receivables are one of the most scrutinized items on a restoration balance sheet during diligence. Buyers will discount A/R aged over 90 days by 25% to 50% in the working capital peg calculation. Restoration A/R cycles are inherently longer because of carrier supplement disputes and claim adjuster reviews. Cleaning AR aging is a 6-12 month project: tighten supplement turnaround under 60 days, isolate prepaid program deferred revenue, and chase any supplement aged above 180 days to resolution before going to market. Sloppy AR can cost 2% to 5% of enterprise value through the working capital peg alone.
What to Do Next
The restoration owners who get the top-quartile multiple all do the same three things. They start preparing 24 to 36 months before they want to be out. They put a GM in place 12+ months pre-sale and they get the owner out of estimating and supplement disputes. And they invest in a sell-side QoE before any buyer sees a CIM.
The restoration-specific work that adds the most enterprise value sits on top of those fundamentals. Lock in 3+ TPA program enrolments. Earn preferred-contractor status with at least one major carrier at $2M+ in annual program revenue. Build IICRC certification depth across the firm so the Master designations are not concentrated on the owner. Shift mix toward water mitigation and away from CAT chasing. Get the Florida AOB exposure scoped if you operate in Florida. Run the W-2 vs. 1099 audit on reconstruction crews and settle via VCSP if needed. Each one of those moves is a turn of multiple, and together they are the difference between a 5x outcome and a 10x outcome.
If you are 12+ months from a potential exit and want a structured pre-sale optimization roadmap, CT Acquisitions has restoration operations specialists in our partner network who run multi-quarter prep engagements. If you are 6 to 12 months out and ready to start the sell-side process, our M&A advisory team runs the buyer outreach. No fee to you on buy-side introductions; sell-side mandates are paid on success at closing. Either way, the first 30 minutes are free.
Ready to talk?
Schedule a 30-minute exit-readiness call
Or read more: Sell Your Restoration Business (active sale guide) | Buying a Restoration Business (buyer’s playbook) | Private Equity in Restoration 2026: Active Buyers + Multiples
Ready to Explore Your Options?
A 30-minute confidential conversation is all it takes.