
M&A Advisor for Manufacturing Business Owners: How to Pick the Right Firm for Your Sale

By CT Acquisitions Editorial Team, reviewed by senior M&A advisors. Last reviewed: June 2026.
An M&A advisor for a manufacturing business is a sell-side investment banker who specializes in industrial transactions, meaning they understand machinery appraisals, working capital normalization on inventory-heavy balance sheets, cyclicality adjustments to EBITDA, real estate carve-outs with sale-leaseback structures, and the split between strategic acquirers paying for synergies and financial sponsors underwriting a hold. Manufacturing owners hire this specialist because a generalist advisor will miss the 1.0x to 2.0x multiple swing that sits inside these five levers.
You are reading this because you own a metal fabricator, precision machining shop, contract manufacturer, industrial distributor, or specialty product plant doing $5 million to $150 million of revenue and $1 million to $15 million of EBITDA. This guide shows the working manufacturing M&A landscape in 2026, current sector multiples with named sources, the strategic-versus-PE buyer split that changes your net proceeds by seven figures, why cyclicality gets you a discount that a specialist can partially claw back, how real estate and equipment carve-outs actually work, fee structures compared side by side, the honest cutoff where bulge bracket firms stop returning calls, and a practical vetting checklist for interviewing candidate firms.
Key Takeaways
- An M&A advisor for a manufacturing business is a sell-side investment banker or advisory firm that represents the owner in the sale process, from valuation modeling and confidentia…
- Manufacturing M&A volume in the first half of 2026 tracked slightly ahead of H2 2025, with PitchBook reporting middle-market industrial deal count up 8 percent year over year and a…
- Strategic acquirers pay for synergies (revenue overlap, cost consolidation, supply chain lock-in) while private equity sponsors underwrite standalone cash flow and pay for a platfo…
- Normalized EBITDA for a manufacturer requires adjustments a generalist often misses, including cyclicality smoothing, one-time equipment repairs, related-party rent to owner-contro…
- Working capital normalization on a manufacturing deal is more complex than on any other lower middle market sector because of inventory.
What is an M&A advisor for a manufacturing business
An M&A advisor for a manufacturing business is a sell-side investment banker or advisory firm that represents the owner in the sale process, from valuation modeling and confidential marketing materials through curated buyer outreach, offer negotiation, diligence coordination, and closing.
An M&A advisor for a manufacturing business is a sell-side investment banker or advisory firm that represents the owner in the sale process, from valuation modeling and confidential marketing materials through curated buyer outreach, offer negotiation, diligence coordination, and closing. For manufacturers, the specialist adds five industrial-specific workstreams: normalized EBITDA that isolates cyclical years, a working capital target reconciled to inventory turns and receivable seasonality, real estate treatment (sold, carved out, or leased back), machinery and equipment appraisal by a certified ASA appraiser, and a buyer list segmented by strategic industrial platforms versus private equity industrials funds.
Manufacturing M&A is not a niche. Reuters reported that global M&A activity hit $3.9 trillion in 2025, with industrials representing roughly 15 percent of deal value, according to Reuters and PitchBook. The specialization matters because the buyer pool for a $4 million EBITDA precision machining shop is completely different from the buyer pool for a $4 million EBITDA HVAC contractor, even though the deal size and headline multiple look similar.
Manufacturing M&A market: what 2026 actually looks like
Manufacturing M&A volume in the first half of 2026 tracked slightly ahead of H2 2025, with PitchBook reporting middle-market industrial deal count up 8 percent year over year and average enterprise value flat, according to the PitchBook Q2 2026 US PE Breakdown .

Manufacturing M&A volume in the first half of 2026 tracked slightly ahead of H2 2025, with PitchBook reporting middle-market industrial deal count up 8 percent year over year and average enterprise value flat, according to the PitchBook Q2 2026 US PE Breakdown. Private equity industrials funds hold roughly $340 billion of dry powder targeting manufacturers, per PitchBook data, and strategic acquirers have used balance sheets to pursue tuck-ins that lock in supply chains post-tariff realignment.
Deal activity by sub-sector, H1 2026
| Sub-sector | H1 2026 US Deal Count | Median EV | Median Multiple |
|---|---|---|---|
| Metal fabrication | 142 disclosed | $28M | 5.5x to 7.0x |
| Precision machining (aerospace, defense) | 68 disclosed | $45M | 7.0x to 10.5x |
| Contract manufacturing (medical, electronics) | 91 disclosed | $62M | 7.5x to 11.0x |
| Industrial distribution | 187 disclosed | $34M | 6.5x to 8.5x |
| Plastics and packaging | 124 disclosed | $48M | 6.0x to 9.0x |
| Building products manufacturing | 76 disclosed | $41M | 5.5x to 8.0x |
| Food and beverage processing | 103 disclosed | $55M | 7.5x to 11.0x |
| Specialty chemicals | 54 disclosed | $88M | 8.0x to 12.0x |
Sources: PitchBook Q2 2026 US PE Breakdown, GF Data Q1 2026 Report, Axial Q2 2026 LMM Pulse, S&P Global Market Intelligence, Boston Consulting Group 2026 M&A Report.
Why multiples shifted in 2026
Three factors moved industrial multiples in 2026. First, the 10-year Treasury settled near 4.1 percent by June, according to FRED data, which pulled LBO models back into positive-yield territory. Second, the Section 232 tariff regime and the Bipartisan Reshoring Act incentives increased the strategic premium buyers pay for domestic capacity, per reporting from The Wall Street Journal. Third, the One Big Beautiful Bill Act (OBBBA) restored 100 percent bonus depreciation on qualifying equipment purchases for tax years 2025 through 2027, per IRS guidance, which meaningfully helps buyers underwrite equipment-heavy manufacturers.
Strategic buyer versus PE buyer: the split that changes your check by seven figures
Strategic acquirers pay for synergies (revenue overlap, cost consolidation, supply chain lock-in) while private equity sponsors underwrite standalone cash flow and pay for a platform they can build. For a manufacturer, the strategic often pays a 0.5x to 2.0x higher multiple than the PE sponsor, but the strategic typically wants an asset deal, a working capital scrub, and full non-competes that can strand value. A skilled manufacturing advisor runs both.
Strategic acquirers pay for synergies (revenue overlap, cost consolidation, supply chain lock-in) while private equity sponsors underwrite standalone cash flow and pay for a platform they can build. For a manufacturer, the strategic often pays a 0.5x to 2.0x higher multiple than the PE sponsor, but the strategic typically wants an asset deal, a working capital scrub, and full non-competes that can strand value. A skilled manufacturing advisor runs both buyer tracks in parallel and forces the strategics to compete against the PE bids on total after-tax proceeds.
Strategic buyer economics for manufacturers
Strategic buyers in manufacturing are large public or private industrials looking for accretive tuck-ins. Illinois Tool Works, Roper Technologies, and Dover Corporation each closed multiple middle-market industrial tuck-ins in 2025, per company 10-K filings on SEC EDGAR. Additional serial industrial acquirers active in the lower middle market include Watts Water Technologies, Graco Inc., Nordson Corporation, Parker Hannifin, Emerson Electric, and Honeywell, per Mergermarket deal databases. Strategic acquirers typically pay for cost synergies (headcount, overhead, procurement), revenue synergies (cross-selling into a bigger customer base), and defensive value (blocking a competitor). For a metal fabricator supplying a strategic’s existing OEM customer, that customer overlap can add 1.5x to the price they pay.
Strategic acquirers also pay for reshoring-driven scarcity. The US Department of Commerce tracked $214 billion of announced manufacturing capex committed to US expansion between 2023 and 2026, and National Association of Manufacturers data shows domestic capacity utilization above 78 percent for precision machining and metal fabrication. Strategics with existing customer demand often prefer to buy capacity rather than build it, which supports the multiple premium.
PE buyer economics for manufacturers
Private equity buyers of manufacturers split into platform investments and add-ons. Platform buys pay 6.5x to 9.0x for a well-run $5M to $15M EBITDA industrial (see the sub-sector table above). Add-ons paid a 1.5x to 2.5x discount to the platform’s blended multiple, according to GF Data, which is the arbitrage that drives roll-up strategies. Named industrial-focused PE firms active in 2025 to 2026 include AE Industrial Partners, Arcline Investment Management, GTCR, Wynnchurch Capital, Blue Point Capital Partners, Century Park Capital, Incline Equity Partners, Nautic Partners, and CORE Industrial Partners.
Fund-of-fund allocations to industrials sat at approximately 22 percent of committed capital across large LP portfolios in 2026, per Preqin quarterly LP surveys. That allocation puts pressure on GPs to deploy, which puts pressure on multiples at the LMM level. The American Investment Council reports over 3,600 US PE-backed platforms with active industrial roll-up mandates as of Q1 2026. For a manufacturer with $2M to $5M of EBITDA and a clean growth story, that funnel translates into 8 to 15 credible bids in a well-run process.
Strategic versus PE side-by-side for a $4M EBITDA metal fabricator
| Term | Typical Strategic Offer | Typical PE Offer |
|---|---|---|
| Headline multiple | 7.5x ($30M EV) | 6.5x ($26M EV) |
| Structure | Asset deal, cash at close | Stock deal or F reorg, cash at close |
| Rollover equity | None typical | 10 to 25 percent rollover |
| Earnout | Rare, or small transition-based | Common, 10 to 20 percent tied to 12-24 month EBITDA |
| Owner post-close role | Transition consultant, 6 to 12 months | CEO or Chairman, 2 to 5 years |
| Non-compete | Full 5-year, national scope | 3-year, business-specific |
| Working capital target | Aggressive scrub (higher target) | Trailing-12 average, less aggressive |
| Real estate | Often bought or leased at market | Frequently sale-leaseback carve-out |
| Diligence intensity | Moderate (industry knowledge) | High (Q of E, ESG, cyber, environmental) |
The lesson: headline price is a misleading comparison. When your advisor runs an net working capital adjustment analysis and shows you after-tax proceeds net of rollover, earnout risk, escrow, and taxes, the strategic and PE offers often converge or reverse. That comparison is exactly the work a manufacturing-specialist advisor delivers.
How manufacturing EBITDA gets adjusted (and where owners lose money)
Normalized EBITDA for a manufacturer requires adjustments a generalist often misses, including cyclicality smoothing, one-time equipment repairs, related-party rent to owner-controlled real estate, above-market owner compensation, discontinued product lines, and inventory accounting policy changes. The Quality of Earnings (QoE) provider (typically a national firm like Grant Thornton, RSM, BDO, or a boutique like GBQ Partners, HORNE Cyber, or Cohn Reznick) will scrub these adjustments, but the advisor’s job is to.
Normalized EBITDA for a manufacturer requires adjustments a generalist often misses, including cyclicality smoothing, one-time equipment repairs, related-party rent to owner-controlled real estate, above-market owner compensation, discontinued product lines, and inventory accounting policy changes. The Quality of Earnings (QoE) provider (typically a national firm like Grant Thornton, RSM, BDO, or a boutique like GBQ Partners, HORNE Cyber, or Cohn Reznick) will scrub these adjustments, but the advisor’s job is to prep them cleanly so QoE does not haircut them at diligence.
Cyclicality adjustments: LTM versus 3-year average
Manufacturing revenue moves with the business cycle, capital expenditure cycles at OEM customers, and commodity input prices. Buyers argue for the lower of trailing 12 months (LTM) or 3-year average EBITDA in a downcycle, and the LTM only in an upcycle. A specialist advisor pushes back with the argument that the cycle is symmetrical: if the buyer takes the 3-year average in a soft year, they must accept LTM in a peak year. Institute for Supply Management (ISM) Manufacturing PMI hit 46.8 in December 2025 (contraction territory), per ISM, then recovered to 51.4 by May 2026. The Federal Reserve G.17 Industrial Production Index confirmed the recovery, moving from a 2025 low of 101.2 back to 103.9 by May 2026. If you sold in Q1 2026 against the LTM, the 3-year average helped you.
Common EBITDA adjustments buyers accept
- Owner compensation above market (add-back the delta)
- Family members on payroll not doing arm’s-length work
- Personal expenses run through the P&L (auto, travel, insurance)
- Related-party rent above or below fair market value (add-back the delta)
- One-time legal or settlement costs
- One-time equipment repair or overhaul (if truly non-recurring)
- Discontinued product lines
- PPP loan forgiveness (this is not recurring)
Adjustments buyers push back on
- Ongoing R&D or tooling costs called “one-time”
- Deferred maintenance that will be capitalized post-close
- Customer concentration adjustments
- Inventory obsolescence write-offs treated as non-recurring when the pattern is recurring
Working capital normalization: where manufacturing deals get bloody
Working capital normalization on a manufacturing deal is more complex than on any other lower middle market sector because of inventory. The seller starts with an inventory balance on the books, and the buyer sets a target net working capital that becomes the peg for the closing adjustment. If actual working capital at close is below the target, the seller writes a check. If above, the buyer writes a check.
Working capital normalization on a manufacturing deal is more complex than on any other lower middle market sector because of inventory. The seller starts with an inventory balance on the books, and the buyer sets a target net working capital that becomes the peg for the closing adjustment. If actual working capital at close is below the target, the seller writes a check. If above, the buyer writes a check. A one percent error on inventory valuation on a $5M inventory balance is a $50,000 swing to the wrong party.
The four inventory questions the advisor must answer before signing an LOI
- Cost method: FIFO, LIFO, or standard cost, and does the buyer intend to convert (typically to FIFO for a stock deal buyer’s GAAP reporting).
- Slow-moving and obsolete (SLOB) reserve: what is the seller’s current reserve policy, and will the buyer accept the seller’s SLOB or demand a fresh count.
- Physical count timing: 30 or 60 or 90 days pre-close, and how do you reconcile back to the closing balance.
- Consigned or customer-owned inventory: identify anything sitting on the shop floor that is not the seller’s to sell.
Working capital target calculation methods
| Method | How It Works | Typical Use | Owner Impact |
|---|---|---|---|
| Trailing 12-month average | Sum monthly NWC, divide by 12 | PE buyer default | Neutral in stable business |
| Trailing 6-month average | Sum last 6 months NWC, divide by 6 | Growth stories | Favors seller if growing |
| 3-year average | Sum 36 months, divide | Cyclical businesses | Smooths peaks and troughs |
| Days-based (DSO, DPO, DIO) | Rebuild NWC from ratios applied to LTM sales | Sophisticated PE, strategic | Advantageous if ratios are improving |
| Peak method | Highest month of the year | Aggressive strategic buyer | Punishing to seller |
A manufacturing specialist negotiates the method in the LOI, not after signing. The net working capital adjustment is the single most common source of post-close disputes in manufacturing M&A, according to Marsh McLennan‘s transactional risk data.
Real estate and equipment: two big carve-out questions
Owner-occupied real estate and heavy machinery are two structural questions unique to manufacturing that must be resolved before you sign an LOI. Most lower middle market manufacturing sales carve real estate out into a sale-leaseback structure where the operating company signs a triple-net lease with the owner’s remaining real estate entity or a third-party industrial REIT. Equipment goes with the business but requires an independent appraisal because purchase accounting rules.

Owner-occupied real estate and heavy machinery are two structural questions unique to manufacturing that must be resolved before you sign an LOI. Most lower middle market manufacturing sales carve real estate out into a sale-leaseback structure where the operating company signs a triple-net lease with the owner’s remaining real estate entity or a third-party industrial REIT. Equipment goes with the business but requires an independent appraisal because purchase accounting rules under ASC 805 require fair-value allocation and buyers use the appraisal to underwrite depreciation.
Real estate: sell, carve out, or lease back
| Structure | How It Works | When It Fits | Tax Impact |
|---|---|---|---|
| Sell together | Buyer purchases real estate at appraised value | Buyer wants to own footprint, unique fit | Depreciation recapture on real estate, capital gains |
| Sale-leaseback to owner LLC | Owner keeps real estate, opco signs 10 to 15 year triple-net lease | Owner wants annuity income | Deferred gain, rental income taxed as ordinary or passive |
| Sale to industrial REIT | Real estate sold to REIT, opco signs long-term lease | Owner wants cash | Capital gain, no more landlord role |
| 1031 exchange | Owner redeploys real estate proceeds into like-kind property | Defer real estate gain | Deferred until final disposition |
| Retain in family entity | Real estate held for legacy or next generation | Family office structure | Ongoing rental income, step-up at inheritance |
Sale-leaseback pricing in 2026 traded at cap rates of 6.5 to 8.0 percent for industrial buildings, per CBRE’s H1 2026 Industrial Cap Rate Survey. A $3M annual rent stream at a 7 percent cap rate is $42.9 million of real estate value, often exceeding the enterprise value of the operating company. Manufacturing owners frequently miss that the real estate is the bigger asset.
Equipment and machinery appraisal
Equipment must be appraised by a certified American Society of Appraisers (ASA) machinery and equipment appraiser. The appraisal drives three outcomes: purchase price allocation under IRC Section 1060 for asset deals, ASC 805 fair value under GAAP for stock deals, and lender collateral value for the buyer’s senior debt. Named ASA-credentialed appraisal firms often used in mid-market manufacturing deals include Hilco Global, Great American Group, Perella Weinberg’s asset services, and Tiger Group.
The appraisal produces three values: Fair Market Value in Continued Use (FMV-CU, highest), Orderly Liquidation Value (OLV, middle), and Forced Liquidation Value (FLV, lowest). For a going-concern sale, FMV-CU is the applicable number. Owners often see the FLV number in a lender’s collateral analysis and get confused. Your advisor should walk you through all three.
Cyclicality risk: premium or discount, depending on what you make
Manufacturing cyclicality shows up in valuation two ways. Sub-sectors tied to the broad capex cycle (metal fabrication for OEMs, industrial distribution, machine tools) trade at a 0.5x to 1.5x multiple discount to less cyclical peers, because buyers underwrite a normalized rather than peak-cycle EBITDA. Sub-sectors with defensive end markets (medical device contract manufacturing, aerospace and defense precision machining, essential food processing, water infrastructure products) trade at a 0.5x to 1.5x.
Manufacturing cyclicality shows up in valuation two ways. Sub-sectors tied to the broad capex cycle (metal fabrication for OEMs, industrial distribution, machine tools) trade at a 0.5x to 1.5x multiple discount to less cyclical peers, because buyers underwrite a normalized rather than peak-cycle EBITDA. Sub-sectors with defensive end markets (medical device contract manufacturing, aerospace and defense precision machining, essential food processing, water infrastructure products) trade at a 0.5x to 1.5x premium because their earnings streams look more like a services business.
Cyclical versus defensive sub-sector examples
| Sub-sector | Cyclicality | 2026 Multiple Range | Buyer Perception |
|---|---|---|---|
| Aerospace precision machining | Defensive (Boeing, Lockheed backlog) | 7.5x to 10.5x | Premium, long contracts |
| Medical device contract manufacturing | Defensive | 8.5x to 12.0x | Premium, regulated moat |
| Water and wastewater equipment | Defensive | 8.0x to 11.0x | Premium, utility spend |
| Metal fabrication (broad OEM) | Cyclical | 5.5x to 7.0x | Discount, capex-tied |
| Automotive tier 2/3 supply | Highly cyclical | 4.5x to 6.5x | Discount, EV transition risk |
| Machine tools distribution | Highly cyclical | 5.0x to 7.0x | Discount, buyer wants proof of stability |
| Building products (residential exposure) | Cyclical | 5.5x to 7.5x | Discount, tied to housing starts |
| Specialty chemicals (formulated) | Moderately defensive | 8.0x to 12.0x | Premium, sticky customer specs |
A specialist advisor prepares two things to defend against the cyclicality discount: a stability narrative built from customer contracts, backlog, LTA agreements, and product-mix data, and a normalized EBITDA that survives a Q of E scrub with defensible cyclical add-backs. If your business is truly cyclical, some discount is coming. The specialist’s job is to make it 0.5x rather than 1.5x.
Fee structures: what manufacturing M&A advisors actually charge
Manufacturing M&A advisors charge one of three fee structures: a fixed monthly retainer plus a success fee (most common in LMM), a Modified Lehman scale success fee (declining percentage as deal size grows), or a hybrid with a flat retainer, tiered success fee, and performance kickers for exceeding a target price.
Manufacturing M&A advisors charge one of three fee structures: a fixed monthly retainer plus a success fee (most common in LMM), a Modified Lehman scale success fee (declining percentage as deal size grows), or a hybrid with a flat retainer, tiered success fee, and performance kickers for exceeding a target price. Understanding the fee structure is important because a bad structure can push an advisor to take a lower offer just to close, or to overprice and take a listing that never sells.
Common fee structures compared
| Structure | How It Works | Advisor Alignment | Typical LMM Deal ($5M-$50M EV) |
|---|---|---|---|
| Modified Lehman | 5% of first $1M, 4% of next $1M, 3% of next, declining | Weak: bigger deal, bigger dollars, but percent shrinks | Common for larger MM deals |
| Flat percent | 3 to 6 percent of enterprise value at close | Strong: aligned with headline price | Common for LMM under $25M |
| Retainer plus success | $10K to $25K monthly retainer plus 3 to 5 percent success | Strong: retainer funds work, success drives close | Most common in LMM |
| Double Lehman | 10% of first $1M, 8% of next $1M, 6% of next | Aligned but expensive on small deals | Small business brokers |
| Performance kicker | Base 4 percent plus 10 percent of price above a target | Strong: pushes for top-of-market outcome | Sometimes negotiable for premium deals |
For more detail on how fees actually work, see our guides on M&A advisor cost and how much a business broker charges to sell a business. The Alliance of Merger & Acquisition Advisors (AM&AA) publishes benchmark fee data annually.
Retainer versus contingency: which is better for the seller
A retainer plus success fee model is generally better for the seller of a manufacturer, because it means the advisor invests time upfront in the marketing materials, buyer research, and financial preparation without discount, and gets paid to close. A pure contingency deal (no retainer, higher success fee) pressures the advisor to take any offer that closes, which can hurt price. Ask candidate firms exactly what retainer they charge, whether it credits against the success fee (it should), and what the success fee percent is at your expected close range.
The bulge bracket cutoff: where Goldman, Morgan Stanley, and Lazard stop returning calls
Bulge bracket investment banks (Goldman Sachs, Morgan Stanley, JPMorgan Chase, Lazard, Evercore, PJT Partners, Perella Weinberg, and Rothschild) rarely engage on manufacturing deals below $100 million in enterprise value, and their sweet spot starts closer to $250 million. Below that, they either refer you to their middle market colleagues (Baird, Lincoln International, Harris Williams, Houlihan Lokey, William Blair, Piper Sandler, Raymond James, Robert W. Baird) or politely decline. The middle.
Bulge bracket investment banks (Goldman Sachs, Morgan Stanley, JPMorgan Chase, Lazard, Evercore, PJT Partners, Perella Weinberg, and Rothschild) rarely engage on manufacturing deals below $100 million in enterprise value, and their sweet spot starts closer to $250 million. Below that, they either refer you to their middle market colleagues (Baird, Lincoln International, Harris Williams, Houlihan Lokey, William Blair, Piper Sandler, Raymond James, Robert W. Baird) or politely decline. The middle market firms themselves drop out below roughly $25 million in enterprise value.
Advisor tier by manufacturing deal size (typical 2026)
| Deal Size (Enterprise Value) | EBITDA Range | Advisor Tier | Named Examples |
|---|---|---|---|
| Under $2M EV | Under $500K | Business broker | Sunbelt Business Brokers, Transworld Business Advisors |
| $2M to $10M EV | $500K to $2M | Lower LMM advisor | Boutique M&A firms, regional advisors |
| $10M to $50M EV | $2M to $8M | LMM M&A advisor | CT Acquisitions, Generational Equity, Beringer Capital |
| $50M to $250M EV | $8M to $30M | Middle market IB | Harris Williams, Baird, Lincoln International, Cascadia |
| $250M to $1B EV | $30M to $100M | Upper middle market IB | Houlihan Lokey, William Blair, Piper Sandler, Jefferies |
| $1B plus EV | $100M plus | Bulge bracket | Goldman Sachs, Morgan Stanley, JPMorgan, Lazard, Evercore |
For LMM manufacturers between $5M and $50M in EV, the correct advisor tier is a specialist LMM M&A firm with named industrial experience. See our full breakdown at M&A advisor for how the tiers work across all sectors.
Advanced manufacturing and engineered products: finding a sub-sector M&A advisor
Industrial investment banks split their coverage into sub-sector teams, and “advanced manufacturing and engineered products” is one of the most common labels. It covers precision-machined components, motion and flow control, sensors, specialty materials, and parts sold into aerospace, defense and medical supply chains. These businesses sell on specifications and customer qualification, so buyers underwrite things a generalist broker rarely prices.
- Build-to-spec vs build-to-print. Revenue from parts you designed, or drawings you own, is stickier than revenue from printing a customer’s drawing. A specialist splits the two in the CIM because buyers pay more for the first.
- Qualifications. Certification to published quality standards such as AS9100 for aerospace, ISO 13485 for medical devices and IATF 16949 for automotive, plus approved-supplier status at named OEMs, takes years to earn. The advisor should show buyers how long a competitor would need to qualify.
- Sole-source positions. Parts where you are the only qualified supplier support a premium, and buyers will test each claim in diligence.
- Export controls. If you hold ITAR registration, the State Department’s DDTC requires notice of a change in ownership under 22 CFR 122.4, with advance notice when the buyer is foreign. A specialist builds that into the timeline and the buyer list.
How to build a shortlist. Axial’s advisor directory lists 429 manufacturing M&A advisory firms, so start by filtering hard. Ask each candidate for engineered-products deals they closed in the last three years at your size, the buyers on those deals, and who on their team ran them. Firms that market dedicated manufacturing practices include PMCF, Prairie Capital Advisors, KSM Corporate Finance and Capstone Partners. At larger deal sizes, Houlihan Lokey says its Industrials Group ranked as the No. 1 M&A advisor for global industrials transactions under $5 billion in 2025. Whoever you interview, the test is the same: named deals in your sub-sector, not a general industrial pitch.
How to evaluate a manufacturing M&A advisor: a 12-question checklist
Interview at least three candidate advisors before you sign an engagement letter. The strongest questions test whether the advisor has actually closed manufacturing deals in your sub-sector at your size, not whether they can present slickly. Ask for named recent transactions, the specific PE and strategic buyers they have direct relationships with, and how they handle the five manufacturing-specific workstreams (EBITDA normalization, working capital, real estate, equipment, and cyclicality).
Interview at least three candidate advisors before you sign an engagement letter. The strongest questions test whether the advisor has actually closed manufacturing deals in your sub-sector at your size, not whether they can present slickly. Ask for named recent transactions, the specific PE and strategic buyers they have direct relationships with, and how they handle the five manufacturing-specific workstreams (EBITDA normalization, working capital, real estate, equipment, and cyclicality).
Twelve questions to ask every candidate
- Name the last five manufacturing deals you closed in my sub-sector, with year, deal size, and outcome.
- How many industrial PE funds are in your outreach database, and which ones do you have direct partner-level relationships with?
- What is your average time from engagement to LOI in a manufacturing deal like mine, and to close?
- Who at your firm will actually run the day-to-day process, senior partner or a VP or associate?
- How do you handle the working capital target negotiation, and can you show me the last three you negotiated?
- What is your view on real estate treatment for my business (sell, carve out, or lease back)?
- Which ASA equipment appraiser do you typically use, and why?
- How do you present cyclicality in the CIM, and what data do you use to argue against a cyclical discount?
- What is your fee structure, and does the retainer credit against the success fee?
- Do you take a break-up fee if we walk away from the process, and what is it?
- What are your close rate and average price-to-target-price on deals like mine?
- Give me two references, one that had a great outcome and one that did not, and why.
Red flags to walk away from
- Advisor cannot name specific recent manufacturing transactions in your sub-sector
- Advisor pitches you a price 20 percent above where the sub-sector actually trades
- Advisor’s fee is entirely contingent with no retainer (fine on some deals, but ask why)
- Advisor will not disclose who actually runs the process day to day
- Advisor pushes a listing on a marketplace like BizBuySell as their primary strategy
- Advisor refuses to give real references
Certifications and industry associations that matter
Manufacturing M&A advisors do not require a license the way real estate brokers do, but three credentials signal seriousness. The FINRA Series 7 and 79 licenses (held by advisors at broker-dealers) are required to legally receive success fees on securities transactions in most stock-deal structures. The CM&AA (Certified M&A Advisor) designation from the AM&AA is a voluntary competency credential. Membership in the AM&AA, Association for Corporate Growth ( ACG ).
Manufacturing M&A advisors do not require a license the way real estate brokers do, but three credentials signal seriousness. The FINRA Series 7 and 79 licenses (held by advisors at broker-dealers) are required to legally receive success fees on securities transactions in most stock-deal structures. The CM&AA (Certified M&A Advisor) designation from the AM&AA is a voluntary competency credential. Membership in the AM&AA, Association for Corporate Growth (ACG), or the Alliance of Merger & Acquisition Advisors indicates active participation in the professional community.
The distinction between a registered broker-dealer and a pure advisory shop matters. If the sale is a stock deal (or a hybrid with a substantial equity component), a fee paid to an unregistered advisor could be subject to a Section 29 SEC rescission risk. Ask your candidate whether they are registered, and if not, how they handle stock deals. The SEC’s 2020 M&A Broker No-Action Letter and the 2023 codification into Section 15(b)(13) of the Securities Exchange Act carved out an exemption for M&A brokers below certain thresholds, per SEC guidance, but structural analysis matters case by case.
Timeline: what a manufacturing sale process actually looks like
A well-run manufacturing sale takes 7 to 11 months from engagement to close, with about 3 to 4 months of preparation, 6 to 10 weeks of marketing, 4 to 6 weeks of LOI negotiation, and 8 to 12 weeks of confirmatory diligence and legal closing.
A well-run manufacturing sale takes 7 to 11 months from engagement to close, with about 3 to 4 months of preparation, 6 to 10 weeks of marketing, 4 to 6 weeks of LOI negotiation, and 8 to 12 weeks of confirmatory diligence and legal closing. Deals move faster when the seller is already prepped (clean financials, QoE done pre-market) and slower when environmental or regulatory diligence gets complex.
Manufacturing sale process by phase
| Phase | Duration | Key Deliverables | Common Delays |
|---|---|---|---|
| Preparation | 12 to 16 weeks | Sell-side QoE, CIM, teaser, financial model, buyer list | Books not clean, family payroll cleanup, related-party rent |
| Marketing | 6 to 10 weeks | Teaser distribution, NDA execution, CIM distribution, management presentations | Slow buyer response in holiday windows |
| LOI | 4 to 6 weeks | Bid comparison, LOI negotiation, exclusivity | Working capital target disagreement |
| Confirmatory Diligence | 6 to 10 weeks | Q of E, environmental Phase 1/2, legal, HR, IT, insurance | Environmental Phase 2 findings, customer concentration |
| Legal and Close | 4 to 8 weeks | Purchase agreement, disclosure schedules, third-party consents | Landlord estoppel, key customer consent, HSR filing |
Environmental diligence is unique to manufacturing. Any facility with historic operations, underground storage tanks, solvent use, or coating operations triggers a Phase 1 environmental site assessment (ESA) per ASTM E1527-21, and about 20 to 30 percent of Phase 1s lead to a Phase 2, according to EPA guidance and industry practitioner surveys. Prep this early; do not let a surprise findings report kill your deal in week 20.
The Hart-Scott-Rodino (HSR) Act triggers a mandatory pre-close antitrust filing at the FTC and DOJ for deals above the current threshold, which the FTC reset to $126.4 million effective February 2026. Most LMM manufacturing deals fall below HSR, but larger strategic transactions do not. Plan for a 30-day waiting period plus potential Second Request risk if the buyer has overlapping market share.
Tax structure choices manufacturing owners face
The tax structure of a manufacturing sale (asset deal, stock deal, F reorganization, or Section 338(h)(10) election) drives the difference between capital gains treatment for the seller (currently 20 percent federal plus 3.8 percent NIIT plus state) and ordinary income treatment on portions like depreciation recapture.
The tax structure of a manufacturing sale (asset deal, stock deal, F reorganization, or Section 338(h)(10) election) drives the difference between capital gains treatment for the seller (currently 20 percent federal plus 3.8 percent NIIT plus state) and ordinary income treatment on portions like depreciation recapture. On an asset deal with heavy equipment depreciation recapture, that difference can be 10 to 20 points of tax, or $1 million to $5 million on a $30 million deal. This is not a footnote decision.
Common structures and tax outcomes for manufacturers
| Structure | Buyer Preference | Seller Tax Result | Notes |
|---|---|---|---|
| Asset deal | Buyer preferred (step-up in basis, depreciation) | Ordinary income on recapture, capital gain on residual | Common in strategic deals |
| Stock deal (C corp) | Seller preferred | Capital gain, single level of tax | May qualify for QSBS Section 1202 |
| Section 338(h)(10) election | Buyer preferred structure, seller taxed as asset deal | Recapture plus capital gain | Requires S corp or QSub; buyer must consent |
| F reorganization | Buyer preferred (step-up) | Capital gain on stock; step-up permitted | See F reorganization sale tax |
| Rollover equity | PE preferred | Tax-deferred on rollover portion | Typically 10 to 25 percent |
The QSBS Section 1202 exclusion (up to $15 million per taxpayer per issuer under OBBBA, up from $10 million pre-2025) can eliminate federal capital gains tax on qualified small business stock held five years or more, per IRS guidance and the statutory text at 26 U.S.C. Section 1202. Manufacturers organized as C corporations from inception may qualify. Get a QSBS analysis done a year before you sell, not the week of closing.
State residency planning also moves the needle. Trust structures created before signing an LOI can shift a slice of capital gains outside high-tax states, per practitioner guidance from AICPA. The Tax Foundation tracks state capital gains rates ranging from 0 percent in states like Florida, Texas, and Tennessee to 13.3 percent in California and 10.9 percent in New York. On a $30 million sale, the state-tax delta between California and Florida is roughly $4 million.
Buyer diligence areas specific to manufacturers
Manufacturing diligence adds five workstreams that a services-business deal does not have: environmental (Phase 1 and often Phase 2 ESA), customer concentration (top-10 customer analysis, LTA review, contract assignability), key employee retention (plant manager, quality manager, machine programmers), regulatory (FDA for medical device contract man…
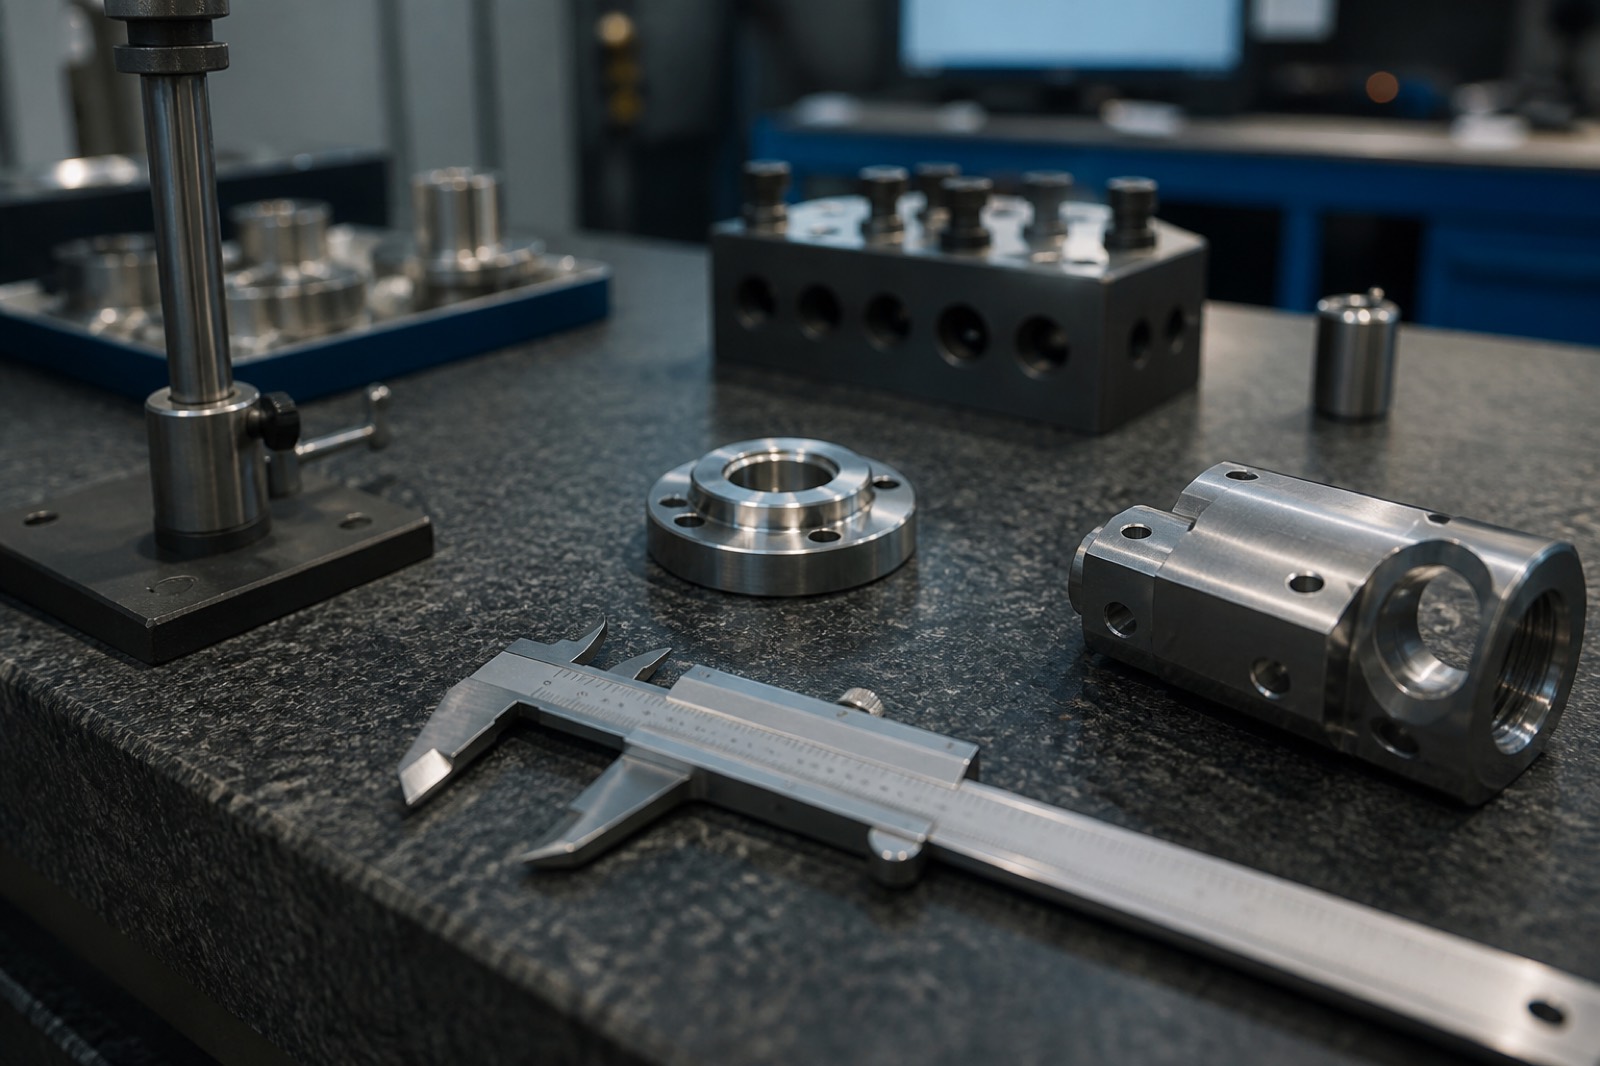
Manufacturing diligence adds five workstreams that a services-business deal does not have: environmental (Phase 1 and often Phase 2 ESA), customer concentration (top-10 customer analysis, LTA review, contract assignability), key employee retention (plant manager, quality manager, machine programmers), regulatory (FDA for medical device contract manufacturing, DOT for automotive tier 2, NADCAP for aerospace, FSMA for food and beverage), and supply chain (single-source raw material exposure, tariff exposure, transit time risk). Prep each of these before you go to market.
Environmental diligence and CERCLA risk
The Comprehensive Environmental Response, Compensation, and Liability Act (CERCLA) can hold a buyer liable for historic contamination on a purchased site, per EPA guidance and the statute at 42 U.S.C. Section 9601. Buyers protect themselves with a Phase 1 ESA and, when triggered, a Phase 2 with sampling. Sellers protect themselves with representations and warranties insurance (RWI) that covers unknown environmental liabilities up to the policy limit. RWI on a manufacturing deal typically prices at 2.5 to 4.0 percent of the coverage limit, per Marsh McLennan and Woodruff Sawyer transactional risk market updates. Total RWI premiums flowing through the M&A market exceeded $91 billion in placed limits in 2025, per AIG and Euclid Transactional reporting.
Customer concentration: the single biggest deal killer
A top-3 customer above 40 percent of revenue is a red flag for most manufacturing buyers. Above 60 percent, it often kills the deal or triggers a large earnout (30 to 50 percent of value tied to customer retention). Fix this before you go to market: land a new anchor customer, diversify the top of the funnel, negotiate long-term agreements with the concentrated customer, or plan a two-year runway to sell rather than a rush to close.
Regulatory certifications: value drivers by sub-sector
Sub-sector-specific certifications materially move buyer interest and multiples in manufacturing M&A. Aerospace and defense precision machining shops with AS9100D (per SAE International) and NADCAP special-process accreditation trade at the top of their range. Medical contract manufacturers with FDA 21 CFR Part 820 compliance and ISO 13485 (per ISO) draw premium bids from strategic medtech acquirers. Food and beverage processors with SQF Level 3 or BRCGS AA certification pass FDA FSMA diligence without renegotiation. Buyers pay for these because the certification cost and clock time to build them from scratch runs 12 to 24 months and $250,000 to $1 million.
Insurance and product-liability review
Product-liability tail coverage is a diligence sticking point in manufacturing deals. Buyers want confirmation that the seller’s general liability, product liability, and umbrella policies remain in force post-close for pre-close product claims, or that the seller has bound a tail (extended reporting period) endorsement. Insurance Information Institute data shows product-liability premiums rose 6.4 percent year over year in 2025 across US industrials. Tail costs on a manufacturing sale typically run 150 to 250 percent of the expiring annual premium for a six-year tail, and are commonly split between buyer and seller.
Our approach at CT Acquisitions
CT Acquisitions is a sell-side and buy-side M&A advisor focused exclusively on lower middle market transactions with enterprise values of $5 million to $50 million, including a deep industrial vertical practice covering metal fabrication, precision machining, contract manufacturing, industrial distribution, plastics, and specialty chemicals.
CT Acquisitions is a sell-side and buy-side M&A advisor focused exclusively on lower middle market transactions with enterprise values of $5 million to $50 million, including a deep industrial vertical practice covering metal fabrication, precision machining, contract manufacturing, industrial distribution, plastics, and specialty chemicals. Our fee structure is a transparent monthly retainer that credits fully against the success fee, so the total cost is aligned with getting the deal closed at the right price, not with running a marketing exercise.
We run curated buyer outreach rather than marketplace listings, meaning every buyer contact starts as a partner-level phone call or a direct email to a PE partner or corporate development lead we already know. Our industrial buyer list includes over 300 active private equity industrials platforms plus roughly 500 strategic industrial acquirers segmented by sub-sector. Our engagements are led by a senior advisor directly, not delivered by a junior associate. If your business sits in the $5 million to $50 million EV band, we would be glad to walk through your situation on a call.
Schedule a 30-minute exit-readiness call at ctacquisitions.com/contact-us/, or read our related guides on sell-side advisory, why hire an M&A advisor, and how to value a business.
Frequently Asked Questions
What is an M&A advisor for a manufacturing business?
An M&A advisor for a manufacturing business is a sell-side investment banker who specializes in industrial transactions, handling machinery appraisals, working capital normalization on inventory-heavy balance sheets, cyclicality-adjusted EBITDA, real estate carve-outs, and buyer outreach to both strategic industrials and private equity industrials funds. They typically charge a retainer plus 3 to 5 percent success fee and close deals in 7 to 11 months.
How much does an M&A advisor charge to sell a manufacturing company?
An M&A advisor for a lower middle market manufacturing company typically charges a monthly retainer of $10,000 to $25,000, credited against a success fee of 3 to 5 percent of enterprise value at close. On a $20 million EV deal, total fees run roughly $600,000 to $1 million. Larger deals scale down in percentage terms via Modified Lehman or negotiated tiered fees.
What EBITDA multiple do manufacturing businesses sell for in 2026?
Manufacturing businesses sell for 4.5x to 12.0x EBITDA in 2026, depending on sub-sector, size, and cyclicality. Broad metal fabrication and cyclical distribution trade at 5.5x to 7.5x, while aerospace precision machining, medical contract manufacturing, and specialty chemicals reach 8.0x to 12.0x. Size premium adds roughly 1.0x to 2.0x moving from micro to core LMM to lower middle market.
Should I sell my manufacturing business to a strategic buyer or a private equity firm?
Whether to sell to a strategic or a PE firm depends on your goals for post-close role and after-tax proceeds. Strategics often pay 0.5x to 2.0x higher headline multiples but demand asset deals, aggressive working capital targets, and full non-competes. PE offers usually include rollover equity and a longer owner role but with a cleaner working capital scrub. A specialist advisor runs both tracks in parallel and compares after-tax proceeds directly.
What is normalized EBITDA for a manufacturer, and what add-backs are accepted?
Normalized EBITDA for a manufacturer strips out one-time items and owner-specific costs to show sustainable earnings power. Accepted add-backs include above-market owner compensation, personal expenses run through the business, related-party rent adjustments, one-time legal costs, discontinued product lines, and non-recurring equipment repair. Buyers push back on ongoing R&D called “one-time,” deferred maintenance, and customer-concentration adjustments.
How is working capital calculated when selling a manufacturing business?
Working capital in a manufacturing sale is calculated as current assets (accounts receivable, inventory, prepaid expenses) minus current operating liabilities (accounts payable, accrued expenses, customer deposits), excluding cash and debt. Buyers set a target based on the trailing 12-month average, 6-month average, or 3-year average, and the closing balance is trued up against that target. Inventory valuation is the largest source of dispute.
Should I sell my manufacturing real estate with the business?
Owners typically carve real estate out of a manufacturing sale via a sale-leaseback where the operating company signs a 10 to 15 year triple-net lease with the owner’s real estate LLC or a third-party industrial REIT. In 2026, industrial cap rates ran 6.5 to 8.0 percent, per CBRE, and the real estate often exceeds the operating company’s enterprise value. Retaining real estate creates an annuity income stream and may qualify for 1031 exchange treatment.
How long does it take to sell a manufacturing business?
A manufacturing sale takes 7 to 11 months from advisor engagement to close: 12 to 16 weeks of preparation (financial cleanup, QoE, CIM), 6 to 10 weeks of marketing, 4 to 6 weeks of LOI negotiation, and 8 to 12 weeks of confirmatory diligence and legal close. Environmental Phase 2 findings, customer concentration issues, or landlord estoppel delays can add 4 to 8 weeks.
What is an advanced manufacturing and engineered products M&A advisor?
It is an investment banker or M&A firm that specializes in companies making precision, specification-driven products such as machined components, motion and flow control parts, sensors and aerospace or medical parts. These advisors know how buyers value customer qualifications, build-to-spec designs and sole-source positions, and they keep relationships with the strategic acquirers and private equity funds that buy in the niche.
What is the difference between an industrial M&A advisor and a manufacturing M&A advisor?
Industrial is the wider label. An industrial M&A advisor covers manufacturing plus distribution, industrial services, building products and transportation. A manufacturing M&A advisor focuses on companies that make products, so they go deeper on inventory, equipment appraisals, plant real estate and customer qualifications. Many industrial banks have a manufacturing team inside the group, so ask who would run your deal.
Who are the Big 4 in M&A, and should a manufacturer hire one?
The Big 4 are Deloitte, PwC, EY and KPMG. Each runs transaction services such as quality of earnings, tax structuring and diligence, plus a corporate finance arm that advises on sales. Lower middle market manufacturers most often hire a Big 4 or regional accounting firm for the sell-side quality of earnings report, and a specialist M&A advisor to run the sale itself.