The 2024-2026 US Investment Banking M&A League Tables Replicated: Goldman #1, Lazard $3.099B, Evercore $3.880B (+29%), Houlihan $2.39B
M&A league tables rank investment banks by the deal value or deal count they advised on: Goldman Sachs led 2025 with $1.66 trillion and still leads 2026, at $1.53 trillion through September, per Mergermarket.
Key takeaways
- Goldman Sachs is #1 in the January to September 2026 global table with $1.53 trillion and a 44.3% share; JPMorgan ($1.11 trillion) and Morgan Stanley ($1.02 trillion) follow (Mergermarket 9M26, Oct 1, 2026).
- Full year 2025: Goldman $1.66 trillion, JPMorgan $1.44 trillion, Morgan Stanley $1.17 trillion; Centerview Partners ($542.3 billion) and Wells Fargo ($449.9 billion) entered the top 10 (Mergermarket FY25, Jan 5, 2026).
- The same 2025 market measures $4.6 trillion and 68 megadeals at LSEG via Reuters, but about $5.1 trillion and 70 megadeals at Mergermarket. Always cite the provider.
- Provider choice can flip the order: GlobalData ranks JPMorgan first in North America for 2025 at $763.9 billion and Goldman third at $581.5 billion (GlobalData via Just Auto).
- Houlihan Lokey is the deal-count leader among banks: 359 deals in 9M26, second only to PwC (451), and 644 closed Corporate Finance deals in the fiscal year to March 31, 2026 (Houlihan Lokey 8-K).

What are M&A league tables?
M&A league tables are ranked lists of financial advisers ordered by the announced deal value or number of deals each one advised on over a period. Mergermarket, LSEG, Dealogic, Bloomberg, PitchBook and GlobalData each publish their own. Because each provider credits deals by its own rules, the same bank can rank first in one table and third in another for the same year.
Two numbers drive every table. Value ranks reward mega deals: 70 deals above $10 billion made up a record share of 2025 volume in Mergermarket FY25 rankings. Count ranks reward deal flow, which is why accounting firms PwC (660 deals) and KPMG (525) top the 2025 count table while no Big Four firm appears in the value top 10.
The table below holds the most cited numbers on this page, each with its provider and release date.
| Measure | Figure | Provider and date |
|---|---|---|
| #1 by value, January to September 2026 | Goldman Sachs, $1.53 trillion, 44.3% share | Mergermarket, Oct 1, 2026 |
| #1 by value, full year 2025 | Goldman Sachs, $1.66 trillion, 36.4% share, 40 megadeals | Mergermarket, Jan 5, 2026 |
| #1 by value, full year 2024 | Goldman Sachs, above $1 trillion, 430 deals | Mergermarket, Jan 6, 2025 |
| #1 by global investment banking fees, 2025 | JPMorgan Chase | Dealogic, cited in JPMorgan 2025 annual report |
| Global announced M&A, 2025 | $4.6 trillion (LSEG); about $5.1 trillion (Mergermarket) | Reuters Jan 8, 2026; ION Jan 5, 2026 |
| Global announced M&A, January to September 2026 | $4.4 trillion, up 27% | Mergermarket, Oct 1, 2026 |
Who tops the M&A league tables in 2026?
Goldman Sachs tops the 2026 M&A league tables. Through September 30, 2026 it advised on $1.53 trillion of announced deals, a 44.3% share, up 33.9% on the same period of 2025, per Mergermarket. JPMorgan is second at $1.11 trillion and Morgan Stanley third at $1.02 trillion. Lazard is the highest-ranked independent advisory firm, sixth at $378.2 billion.
| Rank | Adviser | Deal value | Change vs 9M25 |
|---|---|---|---|
| 1 | Goldman Sachs | $1.53 trillion | +33.9% |
| 2 | JPMorgan | $1.11 trillion (355 deals) | +23% |
| 3 | Morgan Stanley | $1.02 trillion (299 deals) | +26.5% |
| 6 | Lazard | $378.2 billion | +55.9% |
| 8 | UBS | $364.2 billion | +51.4% |
| 9 | Rothschild | $358.3 billion | +81.3% |
| 11 | Wells Fargo | $320.7 billion | +20.2% |
| 12 | Barclays | $318.5 billion | -1.7% |
| 14 | Jefferies | $272.5 billion | -4.2% |
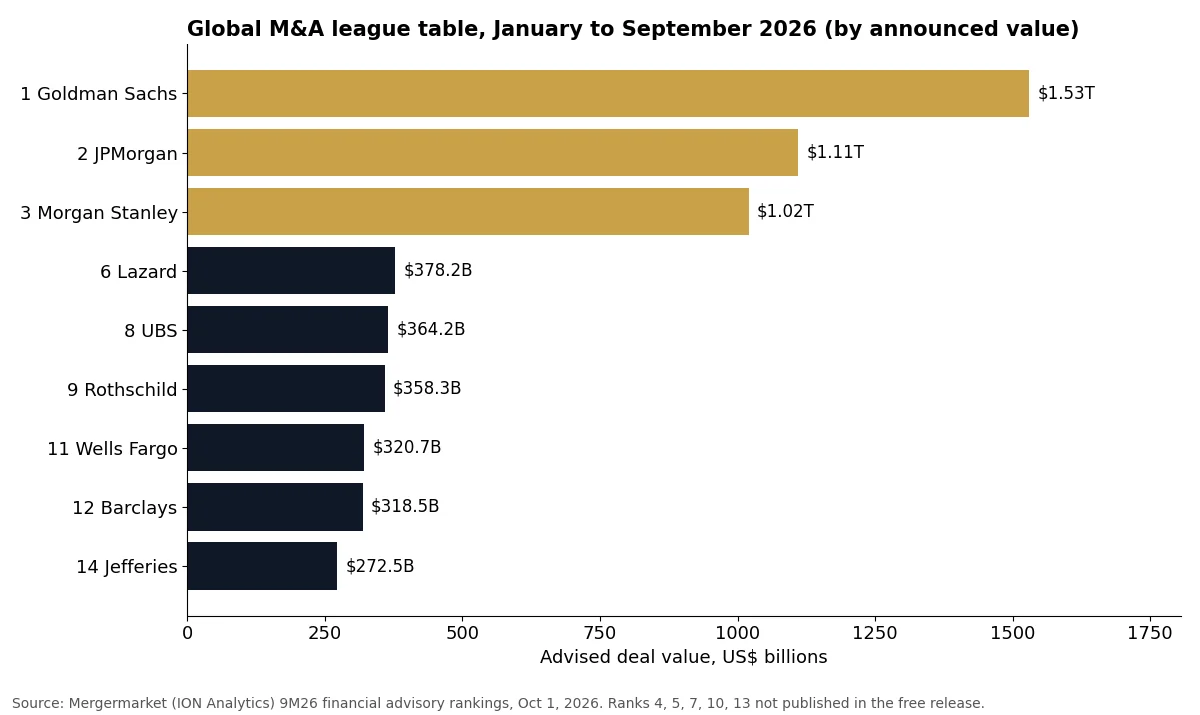
The ION release prints JPMorgan and Morgan Stanley as “USD 1.11bn” and “USD 1.02bn”. Those are trillions: Goldman is printed as USD 1.53tn and the three banks’ shares (44.3%, 32% and 29.5%) only reconcile at the trillion scale. Regional 2026 leaders from the same release: Goldman leads the US with $1.14 trillion across 259 deals, the UK with $248.1 billion across 77 deals and DACH with $158 billion across 38 deals.
Dealogic agrees on the order at mid-year. Goldman passed $1 trillion of announced M&A in the first half of 2026 and JPMorgan ranked second, per Dealogic data cited by Hargreaves Lansdown on June 17, 2026. Deals can still drop out before closing, so the 2026 full-year table due in early January 2027 can differ from these year-to-date ranks.
What did the 2025 full-year M&A league tables show?
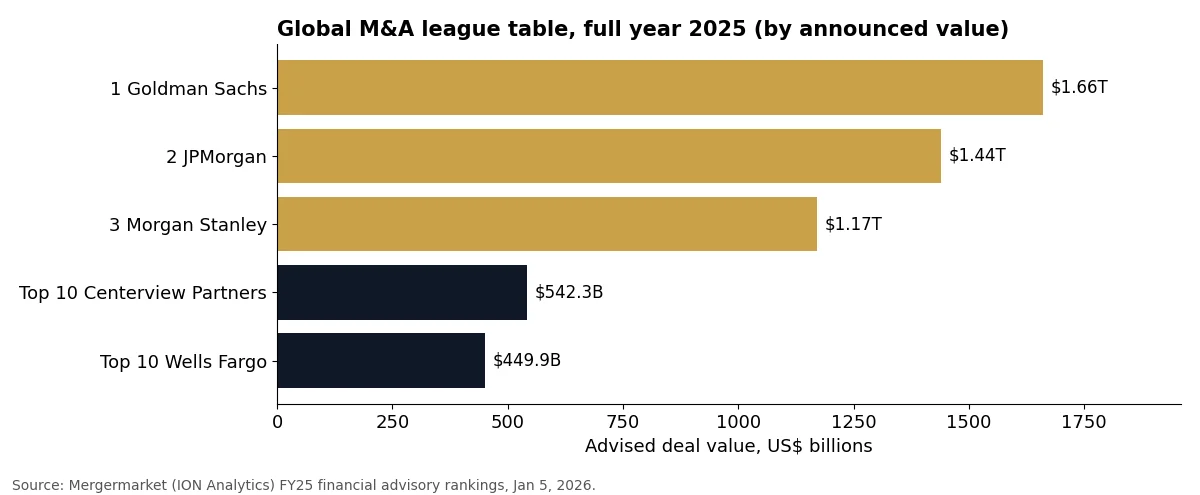
The 2025 full-year M&A league tables put Goldman Sachs first by value with $1.66 trillion, 40 megadeals and a 36.4% share, per Mergermarket on January 5, 2026. JPMorgan ranked second at $1.44 trillion and Morgan Stanley third at $1.17 trillion. Centerview Partners and Wells Fargo entered the top 10, pushing UBS to 11th and Deutsche Bank to 13th.
| Rank | Adviser | Deal value 2025 | Megadeals | Change vs 2024 |
|---|---|---|---|---|
| 1 | Goldman Sachs | $1.66 trillion | 40 | +38.9% |
| 2 | JPMorgan | $1.44 trillion | 32 | +44.2% |
| 3 | Morgan Stanley | $1.17 trillion | 24 | +32.8% |
| Top 10 | Centerview Partners | $542.3 billion | n/a | +52.3% |
| Top 10 | Wells Fargo | $449.9 billion | n/a | +61.7% |
| 11 | UBS | n/a | n/a | n/a |
| 13 | Deutsche Bank | n/a | n/a | n/a |
US and deal-count tables for 2025
In the US, Goldman ranked first with $1.2 trillion across 350 deals and JPMorgan second with $1.13 trillion across 324 deals. By count, the global table is led by accounting firms, and Houlihan Lokey led private equity buyouts (68 deals) and exits (95 deals), per the same ION Analytics FY25 release.
| Table | #1 | #2 | Other named |
|---|---|---|---|
| US by value | Goldman Sachs, $1.2 trillion, 350 deals | JPMorgan, $1.13 trillion, 324 deals | n/a |
| Americas by value and count | Goldman Sachs, $1.28 trillion, 372 deals | JPMorgan, $1.18 trillion, 355 deals | Canada: RBC Capital Markets, $113.3 billion, 55 deals |
| Global by count | PwC, 660 deals | KPMG, 525 deals | Goldman Sachs 3rd (515), Deloitte 4th (478) |
| PE buyouts and exits by count | Houlihan Lokey, 68 buyouts ($9.1 billion) | n/a | Houlihan Lokey, 95 exits ($18.1 billion) |
Fee tables tell a different story from value tables. JPMorgan Chase ranked #1 for global investment banking fees in 2025 according to Dealogic, a measure that adds debt and equity underwriting to M&A advice, as its 2025 annual report states. Goldman ranks first on M&A deal value; JPMorgan ranks first on the total fee pool.
What did the 2024 full-year investment banking league tables show?
The 2024 full-year results put Goldman Sachs first by M&A value as the only adviser above $1 trillion, across 430 deals and up 13%, per Mergermarket on January 6, 2025. Morgan Stanley edged JPMorgan for second, about $856 billion against about $805 billion. Lazard (up 58%) and Jefferies (up 81%) were new to the top ten.
| Rank | Adviser | 2024 deal value | Note |
|---|---|---|---|
| 1 | Goldman Sachs | Above $1 trillion, 430 deals | Up 13%; also #1 in the US |
| 2 | Morgan Stanley | About $856 billion | Up 13% |
| 3 | JPMorgan | About $805 billion | Flat |
| Top 10 | Lazard | n/a | New to the top ten, up 58% |
| Top 10 | Jefferies | n/a | New to the top ten, up 81% |
| #1 by count | PwC | 727 deals | Deloitte second with 623 |
| US #1 by count | Houlihan Lokey | n/a | Highest US deal count |
Read side by side, the 2024 to 2026 tables show the same three banks on the podium in every period, with Morgan Stanley and JPMorgan trading second place. The independent firms moved most: Lazard joined the top ten in 2024 and sits sixth in 2026, and Centerview Partners broke into the 2025 top ten with $542.3 billion.
Why do Mergermarket, LSEG, Dealogic and GlobalData disagree?
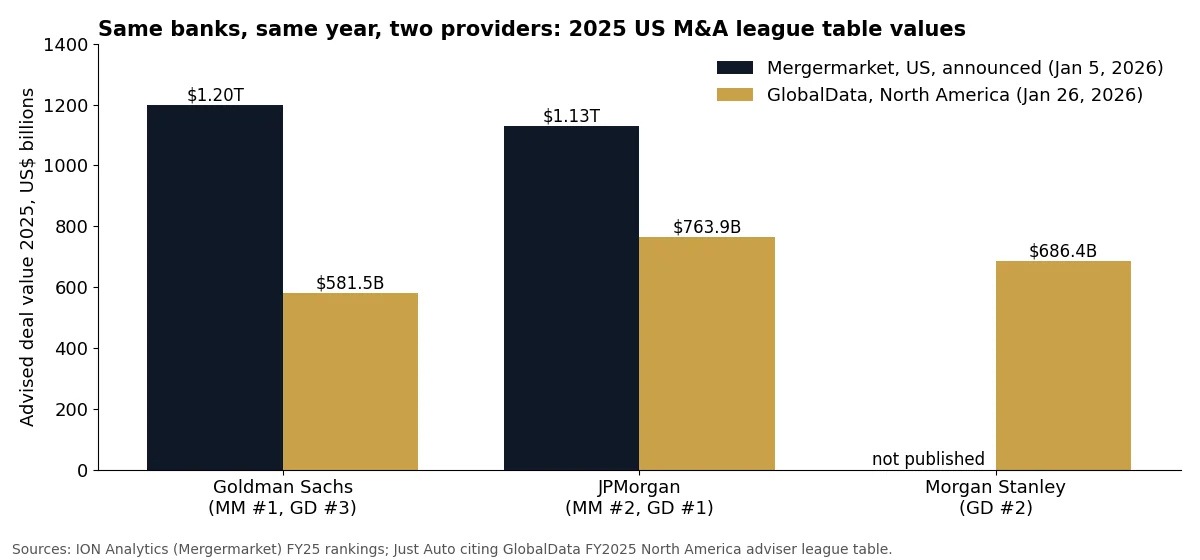
Providers disagree because they count different deals and credit them differently. For 2025, LSEG measured global M&A at $4.6 trillion with 68 megadeals, while Mergermarket measured about $5.1 trillion with 70. In the US, Mergermarket put Goldman Sachs first at $1.2 trillion; GlobalData’s North America table put Goldman third at $581.5 billion and JPMorgan first at $763.9 billion.
| Measure, 2025 | Provider A | Provider B | Source |
|---|---|---|---|
| Global announced M&A value | $4.6 trillion, up 49% (LSEG) | About $5.1 trillion, up 42.5% (Mergermarket) | Reuters, Jan 8, 2026; ION, Jan 5, 2026 |
| Deals above $10 billion | 68 (LSEG) | 70 (Mergermarket) | Same as above |
| #1 adviser by value, US or North America | Goldman Sachs, $1.2 trillion (Mergermarket, US) | JPMorgan, $763.9 billion (GlobalData, North America) | Just Auto citing GlobalData, Jan 26, 2026 |
| Goldman Sachs rank | #1 (Mergermarket, US) | #3, $581.5 billion (GlobalData, North America) | Same as above |
| #1 by deal count | PwC, 660 (Mergermarket, global) | Houlihan Lokey, 210 (GlobalData, North America) | Same as above |
The methodology differences sit in four places. The comparison below lists them per provider; check the criteria page of each release before quoting a rank.
| Provider | Default ranking | Deal status counted | Credit rule | Access |
|---|---|---|---|---|
| LSEG Deals Intelligence (formerly Refinitiv) | Rank value of announced deals | Intended, pending and completed deals | Full credit to every named adviser | Quarterly review PDFs; full tables in LSEG Workspace |
| Mergermarket (ION Analytics) | Announced value and count, by region and sector | Announced deals, dated by announcement | Full credit to every named adviser | Free quarterly summaries; full report on request |
| Dealogic (ION Analytics) | Estimated fees and deal value | Announced and completed | Fee model estimates each bank’s share | Public scorecard; subscription for detail |
| Bloomberg | Deal value | Announced and completed views | Check the Terminal criteria | Bloomberg Terminal |
| PitchBook | Deal count, strong on PE and middle market | See PitchBook criteria | Count per adviser | Quarterly league table articles; subscription |
| GlobalData | Value and volume by region and sector | See GlobalData release notes | Per adviser | Press releases and trade-site summaries |
How full credit double counts one deal
Full credit means every named financial adviser books the whole deal value. On the $35.3 billion Capital One acquisition of Discover, the Capital One Form S-4/A names Centerview Partners for Capital One and PJT Partners and Morgan Stanley for Discover. Each of the three books $35.3 billion, so one deal adds $105.9 billion to the adviser tables.
| Line | Amount | How it is calculated |
|---|---|---|
| Real deal value | $35.3 billion | Announced value |
| Centerview Partners credit | $35.3 billion | Full value, Capital One side |
| PJT Partners credit | $35.3 billion | Full value, Discover side |
| Morgan Stanley credit | $35.3 billion | Full value, Discover side |
| Sum of adviser credit | $105.9 billion | 3 x $35.3 billion |
| Credit per $1 of real deal value | 3.0x | $105.9 billion / $35.3 billion |
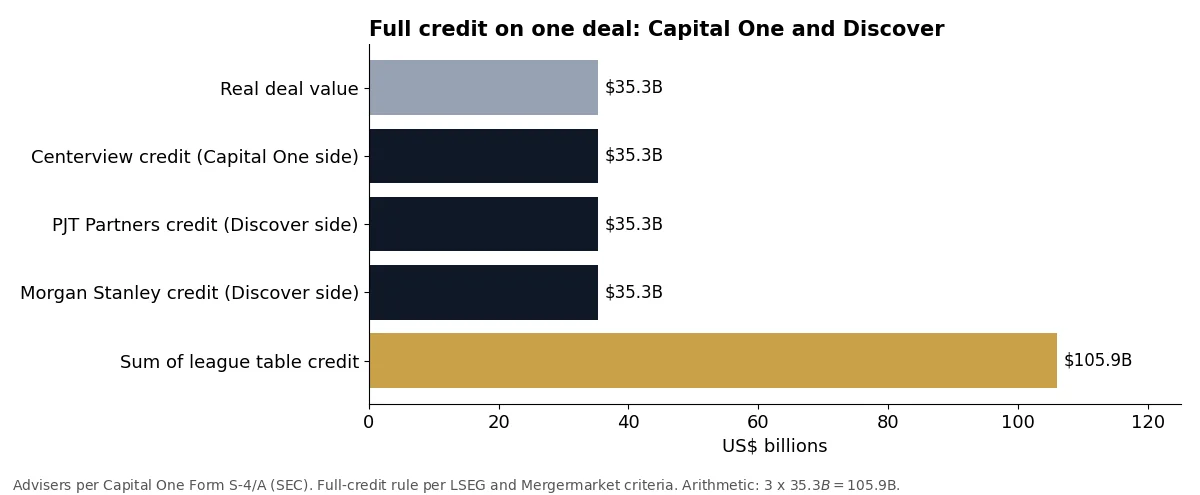
This is why shares in one table add up to more than 100%: Goldman (44.3%), JPMorgan (32%) and Morgan Stanley (29.5%) already sum to 105.8% of the 9M26 base. A share is the fraction of deals a bank touched, not its slice of the fee pool.
Where can you find Mergermarket and other M&A league tables?
Mergermarket publishes free quarterly and annual adviser ranking summaries on the ION Analytics insights site, within the first week after quarter end. LSEG posts quarterly Deals Intelligence reviews, Dealogic runs a public investment banking scorecard, FactSet publishes a Mergerstat Advisor Quarterly PDF, and the Financial Times and The Deal host web league table pages built on provider data.
| Source | How to access | Ranks by | Regional cuts (UK, Germany) |
|---|---|---|---|
| Mergermarket (ION Analytics) | Free summary article per quarter; full PDF on request | Announced value and count | Yes: UK, DACH, Germany, France, Europe tables |
| LSEG Deals Intelligence | Quarterly review PDFs; Workspace for custom tables | Rank value, full credit | Yes, by target nation |
| Dealogic scorecard | Public web scorecard; subscription for detail | Fees and value | By region |
| FactSet Mergerstat | Advisor Quarterly PDF | Value and count by advisor | US focused |
| Financial Times | Web league table pages | Republished provider data | By region and industry |
| The Deal | Web league table page | Deal count, then value on ties | US |
| Axial | Annual lower middle market list | Activity on the Axial network | US lower middle market |
For the UK and Germany, the Mergermarket regional tables are the quickest public route: in 9M26 Goldman Sachs led the UK with $248.1 billion across 77 deals and DACH with $158 billion across 38 deals. University business libraries give students and alumni terminal access for custom cuts by sector or deal size.
How big are the boutiques in the rankings?
The listed advisory boutiques earn a fraction of a bulge bracket’s revenue but now rank inside the value top 10. Evercore reported 2025 net revenues of about $3.88 billion, Lazard $3.099 billion and Houlihan Lokey $2.62 billion for the year to March 31, 2026, against $58.28 billion for Goldman Sachs, per each firm’s filings.
| Firm | Period | Revenue | Advisory detail | Filing |
|---|---|---|---|---|
| Evercore | 2025 | $3.88 billion, up 29% | n/a | Form 10-K |
| Lazard | 2025 | $3.099 billion | Financial Advisory $1.834 billion | FY2025 release |
| Houlihan Lokey | Fiscal year to Mar 31, 2026 | $2.62 billion (FY2025: $2.39 billion) | Corporate Finance $1.74 billion, 644 closed deals | 8-K, May 6, 2026 |
| PJT Partners | 2025 | $1.714 billion, up 15% | n/a | FY2025 release |
| Moelis | 2025 | $1.517 billion (GAAP) | n/a | 4Q 2025 release |
| Goldman Sachs (for scale) | 2025 | $58.28 billion, up 9% | All businesses | Form 8-K |
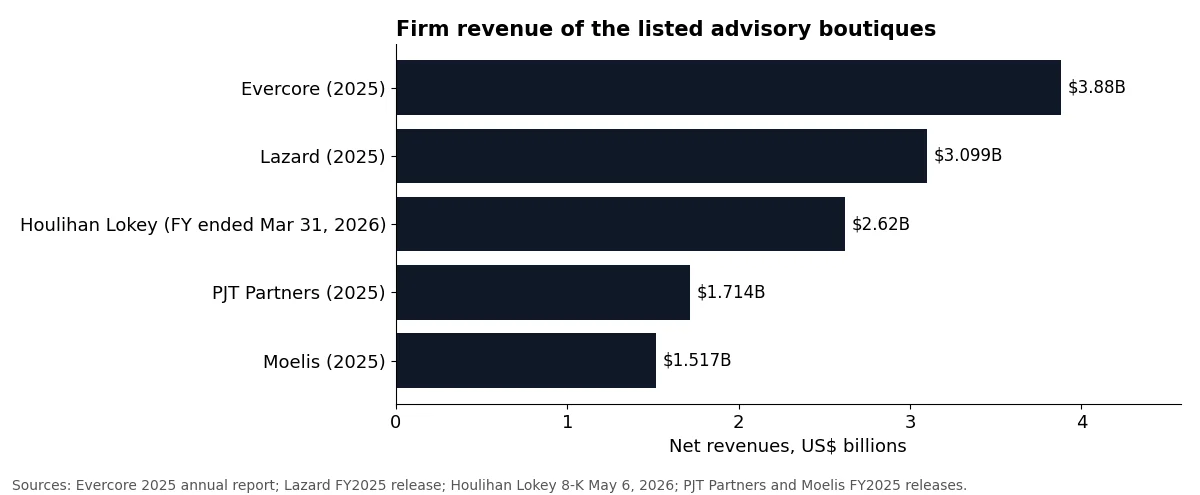
Houlihan Lokey shows the gap between value and count. It ranks second worldwide by count in 9M26 with 359 deals and led 2025 PE buyouts and exits by count, yet it does not appear in the published value top 14, because its deals are mostly middle market.
Which league table should a business owner use?
Business owners should use deal-count tables cut by size band and sector, not the global value table. A value table answers which bank touched the most dollars; an owner selling a $20 million company needs the firm that closes the most sell-side deals of that size in that industry. Use the decision table below, then ask each advisor for its own deal list.
| If your situation is | Use this table | Why |
|---|---|---|
| Enterprise value above $1 billion | Mergermarket or LSEG value table, US, your sector | Mega deals drive value ranks; the 2025 podium advised on 40, 32 and 24 megadeals |
| Enterprise value $100 million to $1 billion | PitchBook or Mergermarket count table, middle market, PE exits | Count leaders such as Houlihan Lokey (95 PE exits in 2025) close most deals here |
| Enterprise value under $100 million | Axial lower middle market list plus the advisor’s own closed-deal list | Global tables rarely reach this band |
| Selling to private equity | Mergermarket PE exits by count | Sponsor exits are ranked separately |
| Cross-border buyer likely (UK, Germany) | Mergermarket regional tables (UK, DACH) | Regional leaders differ from the US table |
| Quoting a rank in a pitch or article | Two providers, with provider name and date | 2025 US #1 differs by provider: Goldman (Mergermarket) vs JPMorgan (GlobalData) |
To turn a published ranking into a shortlist, apply these filters in order:
- Size band first. Pick the enterprise value band that matches your company. A rank in one band says little about another.
- Count, not value. Sort by number of deals; a single $35.3 billion deal outweighs 300 small ones in a value table.
- Sector. Keep firms with at least 3 closed deals in your industry over the last 36 months.
- Sell side only. Drop buy-side and fairness-opinion credits, which full-credit tables count the same as a sale mandate.
- Completed, not announced. Announced deals can still fail; count closings.
- Lead role. Keep deals where the firm ran the process, not a co-adviser seat.
Illustrative example: an owner of an industrial services company worth around $40 million starts in the under $100 million band. The bulge bracket names drop out at step 1. Step 2 surfaces middle market firms that close many small deals, and steps 3 to 6 usually leave 3 to 5 firms with closed, lead, sell-side deals in that sector. That list is often very different from the top 10 on a quarterly release.
CT Acquisitions helps owners of founder-owned businesses with a confidential sale, recapitalization or exit planning, through a network of 500+ buyers. We work for owners on the sell side. Our fee is success only: nothing upfront, and you pay nothing unless the business sells. Book a confidential conversation at our call page, or start with the exit planning guide.
For the next steps, compare boutique vs bulge bracket investment banks, read how to choose an investment bank for selling a business, and prepare the questions to ask an investment banker before hiring. Fee benchmarks by deal size are in investment bank fees for lower middle market deals.
How we compiled this
We compiled these tables in November 2026 from 14 public documents: 3 Mergermarket (ION Analytics) ranking releases for 2024, 2025 and 9M26, Reuters reporting of LSEG’s 2025 totals, a GlobalData North America table, a Hargreaves Lansdown report of Dealogic mid-2026 data, 7 company filings or earnings releases (including JPMorgan’s annual report, which cites Dealogic) and the Capital One Form S-4/A. Ranks not printed in a free release are marked n/a rather than estimated. We excluded unsourced rankings, private-firm revenue estimates and forum posts.
Frequently asked questions
Who is #1 in the M&A league tables in 2026?
Goldman Sachs is #1 in the 2026 M&A league tables. Mergermarket’s January to September 2026 ranking credits it with $1.53 trillion of announced deal value and a 44.3% share, ahead of JPMorgan at $1.11 trillion and Morgan Stanley at $1.02 trillion (ION Analytics, October 1, 2026). Dealogic also had Goldman first at mid-year.
Who topped the investment banking league tables for 2025?
Goldman Sachs topped the 2025 M&A advisory tables by deal value: $1.66 trillion and a 36.4% share in Mergermarket’s full-year ranking, with JPMorgan second at $1.44 trillion. By total investment banking fees across M&A, debt and equity, JPMorgan ranked #1 for 2025 according to Dealogic, as stated in its 2025 annual report.
What are Mergermarket league tables?
Mergermarket league tables are ION Analytics’ quarterly and annual rankings of financial and legal advisers by announced M&A deal value and deal count, split by region and sector. The free release names the leaders; the full tables sit behind registration or a subscription. The FY2025 release ranked PwC first by count with 660 deals.
Why do M&A league tables from different providers disagree?
Providers count different deals and credit them differently. Mergermarket put Goldman Sachs first in the US for 2025 with $1.2 trillion, while GlobalData’s North America table put Goldman third at $581.5 billion and JPMorgan first at $763.9 billion. Announced versus completed status, region definitions and full credit to every adviser explain most of the gap.
Do M&A league tables double count deals?
Yes. LSEG and Mergermarket give full deal value to every named financial adviser. On the $35.3 billion Capital One and Discover deal, Centerview Partners, PJT Partners and Morgan Stanley each received $35.3 billion of credit, so the tables carry $105.9 billion of credit for one transaction. Adviser totals therefore add up to more than the market.
Which league table matters if I am selling a smaller business?
For a business worth under $100 million, deal count in your size band and sector matters more than global value. Houlihan Lokey led Mergermarket’s 9M26 global count with 359 deals while ranking outside the value top 3. Ask each advisor for its closed sell-side deals of similar size over the last 36 months.
Sources
- ION Analytics, Mergermarket 9M26 financial advisory rankings (Oct 1, 2026), accessed November 2026
- ION Analytics, Mergermarket FY25 rankings (Jan 5, 2026), accessed November 2026
- ION Analytics, Mergermarket FY2024 financial advisory ranking (Jan 6, 2025), accessed November 2026
- Reuters on LSEG 2025 global M&A totals (Jan 8, 2026), accessed November 2026
- Just Auto citing GlobalData, North America M&A adviser rankings 2025 (Jan 26, 2026), accessed November 2026
- Hargreaves Lansdown citing Dealogic, Goldman H1 2026 volume (Jun 17, 2026), accessed November 2026
- JPMorgan Chase 2025 Annual Report, accessed November 2026
- Goldman Sachs Form 8-K, fourth quarter 2025 results, accessed November 2026
- Lazard full year 2025 results, accessed November 2026
- Evercore Form 10-K for 2025, accessed November 2026
- Houlihan Lokey Form 8-K, fiscal 2026 results, accessed November 2026
- PJT Partners full year 2025 results, accessed November 2026
- Moelis 4Q 2025 earnings release, accessed November 2026
- Capital One Form S-4/A, Discover transaction, accessed November 2026
About the Author
Christoph Totter is the founder of CT Acquisitions, which helps owners of founder-owned businesses sell confidentially, recapitalize or plan an exit. CT Acquisitions research pages are compiled from public filings, provider releases and court records, with each figure linked to its source.
Last updated: November 9, 2026.