Waste Hauling and Waste Management Business Valuation Multiples: Free Calculator. What’s Your Waste Hauling Business Worth in 2026?
What Is a Waste Hauling Business Worth in 2026?
Quick Answer
Waste hauling and waste management business valuation multiples in 2026 range from 5x EBITDA for sub-$5M residential route haulers without internalized disposal to 11x EBITDA for $20M+ integrated regional consolidators with their own transfer stations or landfill access, and 10x to 13x for platform-grade operators with full hauling, transfer, MRF, and Subtitle D landfill integration. Public-market comparables anchor the upper band: Waste Connections (NYSE: WCN) trades at roughly 16x to 18x EV/EBITDA per company filings, GFL Environmental (NYSE: GFL) at 12x to 14x, and Casella Waste Systems (NASDAQ: CWST) at 18x to 20x. WM’s November 4, 2024 close of the Stericycle acquisition at $7.2B reflected approximately 11x post-synergy EBITDA per WM’s press release. The central valuation drivers are route density measured in lifts per hour, internalization rate (own disposal vs paying third-party tip fees), commercial front-load contract mix, and franchise or exclusive municipal contract footprint.
Thinking about selling your waste hauling business?
Skip the formulas. A 15-minute confidential call gives you a real valuation range and tells you which buyers would compete for your business. No cost, no obligation.
Free Waste Hauling Valuation Calculator
Enter your revenue, commercial front-load mix, and internalization rate. The calculator applies the same size-band and sub-segment logic documented in this guide and returns a starting-point range in under a minute. It is a screening estimate, not a Quality of Earnings.
M&A advisory across 500+ active capital partners · Environmental services M&A: waste hauling, roll-off, transfer, recycling · Updated June 24, 2026
Waste hauling business valuation in 2026 sits at the upper end of the home and environmental services sector, with multiples ranging from 5x EBITDA for small residential route operators to 13x EBITDA for fully integrated platforms that own transfer stations, MRFs, and Subtitle D landfill capacity. The reason is structural: solid-waste collection is a near-perfect recurring-revenue business with high switching costs, contracted route economics, and disposal cost defensibility for operators with internalized landfill or transfer assets. This guide maps the four sub-categories, explains how WM, Republic, Waste Connections, GFL, and Casella underwrite acquisitions, walks through a $3M EBITDA Pennsylvania worked example, and identifies the pre-sale moves that produce the largest multiple expansion. A deeper read on football field valuation covers the underlying methodology buyers use.
How CT Acquisitions Works
- How we are paid. No fee to you on buy-side introductions; sell-side mandates are paid on success at closing.
- Confidential. No public listing, and nothing moves without your approval. We have zero claim on you.
- Vetted buyers only, no leaks. We introduce you only to vetted buyers whose mandates fit. Your business is never publicly listed.
- Top-of-market price AND the right buyer. Our fee scales with sale price (same incentive as a banker), matched on fit, not just the highest check.
- We already know our buyers’ mandates before we pick up the phone with you.
Key takeaways
- 2026 waste hauling multiples span 5x EBITDA (sub-$5M residential routes, no disposal) to 13x EBITDA (platform-grade integrated operators with landfill, transfer, MRF).
- WM’s Stericycle close November 4, 2024 at $7.2B priced approximately 11x post-synergy EBITDA per WM press release.
- Route density (lifts per hour) is the single largest operating-margin lever. Front-load benchmark: 25 to 35 lifts per hour in dense urban markets.
- Internalization rate (own disposal vs third-party tip fees) drives a 1 to 2 turn EBITDA premium for operators with landfill or transfer access.
- Exclusive franchise or municipal contracts (common in California, Washington, Oregon, and parts of New England) command premium multiples.
- CDL Class B driver wage inflation is the largest cost-side risk. National median diesel-vehicle operator wages hit $25 to $32 per hour in 2026 per BLS Occupational Employment Statistics.
Table of contents
- Methodology and data sources
- The short answer: typical waste hauling valuations in 2026
- The four waste hauling business models
- Where the real value lives: front-load commercial plus internalized disposal
- How waste hauling buyers actually calculate the number
- Route density economics: lifts per hour and stops per hour
- Internalization rate and tip-fee economics
- Landfill access and EPA Subtitle D compliance
- CDL driver labor shortage and wage inflation
- CNG fleet conversion and container economics
- MRF integration and single-stream recycling commodity exposure
- The six factors that move waste hauling multiples
- Worked example: $3M EBITDA Pennsylvania waste hauler valuation
- How to increase your waste hauling business value before selling
- Common mistakes that destroy waste hauling valuations
- Frequently asked questions about waste hauling business valuation
- Related resources
Key Takeaways
- CT Acquisitions · 2026 Buyer-Market Signal What Waste Hauling PE Platforms Pay Premium For Across our buy-side conversations with the strategic and PE-backed waste consolidators (W…
- Business profile Typical multiple Example: $3M EBITDA Sub-$5M EBITDA, residential subscription only, no disposal 5.0 to 6.5x EBITDA $15M to $19.5M Sub-$5M EBITDA, roll-off / C&D on…
- Before any waste hauling business valuation, identify which model describes your business.
- Two structural advantages drive the highest waste hauling business valuation outcomes.
- Normalize the EBITDA. Adjust for owner compensation, related-party transactions, personal vehicle expenses, family member payroll, and any deferred truck or container replacement t…
Methodology and data sources
CT Acquisitions · 2026 Buyer-Market Signal
What Waste Hauling PE Platforms Pay Premium For
Across our buy-side conversations with the strategic and PE-backed waste consolidators (WM, Republic Services, Waste Connections, GFL Environmental, Casella, Meridian Waste, Coastal Waste & Recycling, MIRA, Ecowaste, and regional family-office sponsors) in 2026:
- Front-load commercial contracts with auto-renewal language are heavily rewarded. 60-month evergreen contracts with liquidated damages clauses are the gold standard. Operators with 70%+ commercial revenue under contracted terms get a 1x to 2x EBITDA premium.
- Internalization rate trumps headline revenue. A $10M-revenue hauler that internalizes 60%+ of its disposal at owned transfer stations or landfills trades higher than a $20M hauler paying third-party tip fees on 100% of tonnage.
- Geographic density inside a single MSA matters more than scale across multiple metros. A 25-truck operator running tight routes in one metro is worth more per truck than a 50-truck operator spread across four metros.
Multiple at a Glance · 2026
Waste Hauling Business Valuation Multiples · 2026
By operator type, scale, and disposal integration.
Source: CT Acquisitions analysis of waste-services M&A and public-company comparables. WM, Republic, Waste Connections, GFL, Casella SEC filings.
This valuation guide follows CT Acquisitions’ 5-tier source hierarchy: T1 press releases for major sponsor and platform transactions (WM Stericycle close 11/04/2024, Casella add-ons, GFL portfolio sales), T2 SEC filings of public-company comparables (WCN 10-K, RSG 10-K, GFL 20-F, CWST 10-K, WM 10-K), T3 sponsor portfolio pages (Macquarie Asset Management for Meridian Waste, Kinderhook for Coastal Waste), T4 industry-research publishers (Waste Business Journal, Waste Dive, Resource Recycling, GF Data, BMI Mergers, Capstone Partners), and T5 trade press coverage of regional consolidator transactions.
Tier framing: Headline multiple ranges reflect mid-market private-company transactions. Premium platform-tier multiples (10x-13x) reflect institutional-buyer underwriting on businesses that clear specific scale, geographic density, internalization, and recurring-revenue thresholds. Public-market comparables (WCN, GFL, CWST, RSG, WM) trade higher than private comparables because of free-float liquidity and growth optionality.
Verification window: All multiples and operator-tier figures verified June 24, 2026 against the named T4 publishers’ most-recent reports plus CT’s active-engagement data. Multiples are sensitive to diesel-fuel commodity exposure, recycling commodity index pricing, landfill-airspace availability in the target market, and labor-market tightness.
What is the short answer on waste hauling business valuation in 2026?
| Business profile | Typical multiple | Example: $3M EBITDA |
|---|---|---|
| Sub-$5M EBITDA, residential subscription only, no disposal | 5.0 to 6.5x EBITDA | $15M to $19.5M |
| Sub-$5M EBITDA, roll-off / C&D only, no disposal | 5.5 to 7.0x EBITDA | $16.5M to $21M |
| $5M to $20M EBITDA, front-load commercial-led, no internalization | 7.0 to 9.0x EBITDA | n/a (above worked-example scale) |
| $5M to $20M EBITDA, front-load + 30%+ internalization | 8.0 to 10.0x EBITDA | n/a (above worked-example scale) |
| $20M+ EBITDA regional consolidator, partial internalization | 8.5 to 11.0x EBITDA | n/a (above worked-example scale) |
| Platform-grade: full hauling + transfer + MRF + Subtitle D landfill | 10.0 to 13.0x EBITDA | n/a (platform-tier) |
| Exclusive franchise market (CA, WA, OR, parts of NE) | +0.5 to +1.5x premium | added on top |
Source: CT Acquisitions analysis triangulated against Waste Connections (NYSE: WCN), GFL Environmental (NYSE: GFL), Casella (NASDAQ: CWST), and Republic Services (NYSE: RSG) SEC filings, plus WM’s November 4, 2024 close of the Stericycle acquisition at $7.2B (approximately 11x post-synergy EBITDA per WM press release).
Waste Management Business Valuation Multiples by Size: From Main Street to Public Consolidators
Waste management business valuation multiples depend first on size, because small and large companies are priced on different earnings measures and by different buyers.
| Company size | How it is priced | Typical range | Source |
|---|---|---|---|
| Small waste management and recycling businesses sold through BizBuySell | Multiple of seller’s discretionary earnings (SDE) | Middle half of deals at 2.14x to 3.88x SDE, per BizBuySell | BizBuySell valuation benchmarks |
| Haulers below $5M EBITDA without owned disposal, per the size bands above | Multiple of EBITDA | 5.0x to 7.0x EBITDA, per the size-band table above | Size-band table above |
| Commercial-led haulers with $5M to $20M EBITDA, per the size bands above | Multiple of EBITDA | 7.0x to 10.0x EBITDA, per the size-band table above | Size-band table above |
| Integrated regional and platform operators | Multiple of EBITDA | 8.5x to 13.0x EBITDA, per the size-band table above | Size-band table above |
| Public consolidators | Market trading multiple | WM at about 13.1x EBITDA as of September 2026, per multiples.vc | multiples.vc public comps |
The jump from roughly 3x SDE to 5x or more EBITDA is partly arithmetic. SDE adds back the owner’s full pay, so the same business shows a lower multiple on SDE than on EBITDA. The real step-up comes when a hauler has the route density, commercial contracts, and management depth that let a strategic buyer such as WM, Republic Services, Waste Connections, or GFL, or a PE-backed regional consolidator, plug it in as an add-on. Below that threshold the buyer is usually an individual or a small local operator, and the price follows Main Street norms.
Revenue rules of thumb, such as the 0.5x to 1.5x of annual sales cited in DealStream’s waste management industry guide, are a rough check at best. Margins in waste swing widely with disposal costs, so two haulers with the same revenue can be worth very different amounts. Price on normalized earnings, then use revenue only to sanity-check the result.
What are the four waste hauling business models?
Before any waste hauling business valuation, identify which model describes your business. Each trades at a meaningfully different multiple.
Before any waste hauling business valuation, identify which model describes your business. Each trades at a meaningfully different multiple.
1. Residential subscription
Weekly or bi-weekly curbside collection for single-family homes, either under municipal contract (exclusive franchise) or open-subscription (homeowner picks their own hauler). Average revenue per home: $25 to $40 per month in open-subscription markets, $18 to $28 in exclusive-franchise markets where the contract is competitively bid. Route density is critical: a route running 800 to 1,200 homes per day on a rear-load truck with a two-person crew, or 1,000 to 1,500 homes per day on an automated side-load truck with a one-person crew, is profitable. Below those thresholds, fuel and labor costs swallow margin. Multiples: 5x to 7x EBITDA for open-subscription residential at sub-$5M scale. Exclusive-franchise residential trades at a 0.5x to 1.5x premium because revenue is contracted with the municipality for 5 to 10 years.
2. Commercial front-load
Front-load dumpster service for restaurants, retail, offices, schools, hospitals, and industrial customers. Containers range from 2-yard to 8-yard. Pickup frequency is 1x to 6x per week. Average revenue per container per month: $90 to $250 depending on size and frequency. This is the highest-multiple sub-category because commercial contracts are typically 36 to 60 months with automatic renewal, liquidated damages clauses, and CPI escalators. Margins: 25% to 35% EBITDA at scale with route density of 25 to 35 lifts per hour. Multiples: 7x to 9x for $5M to $20M operators, 9x to 11x for $20M+ with partial internalization.
3. Roll-off and C&D (construction and demolition)
Open-top dumpsters (20-yard, 30-yard, 40-yard) for construction sites, demolition, roofing tear-offs, residential cleanouts. Revenue per haul: $400 to $900 plus tipping fees. Highly cyclical with the construction market. Capital-intensive: roll-off containers cost $1,800 to $3,500 per yard of capacity, so a fleet of 200 containers represents $700K to $1.4M of working assets per the container-pricing benchmark from major fabricators (Wastequip, MetalFab, Galbreath). Multiples: 5.5x to 7x at sub-$5M scale, 7x to 9x at $5M to $20M scale when paired with own transfer-station or landfill access for disposal.
4. Integrated transfer / landfill / MRF
Operators that own one or more of: transfer stations (consolidation points for hauling waste before long-haul to landfill), single-stream MRFs (material recovery facilities that sort recyclables), or EPA Subtitle D landfills (regulated municipal solid waste disposal sites). This is the most valuable category because the operator controls the disposal cost line that competitors are paying as a third-party tip fee. National tip fees averaged $59.56 per ton in 2024 per Environmental Research & Education Foundation’s annual survey, with regional ranges from $35 per ton (Mountain West, South Central) to $115+ per ton (Northeast). Multiples: 10x to 13x for fully integrated platforms.
Most waste hauling businesses combine two or three of these models. The valuation methodology weights each component. A $15M-revenue business that is 60% commercial front-load + 25% roll-off + 15% residential, with 30% disposal internalization through one owned transfer station, would be valued primarily on the front-load multiple with adjustments for the other revenue mix and the partial internalization premium.
Where the real value lives: front-load commercial plus internalized disposal
Two structural advantages drive the highest waste hauling business valuation outcomes. The first is front-load commercial contract revenue. The second is internalized disposal. Operators that combine both routinely command 9x to 11x EBITDA, even at $5M to $15M EBITDA scale. Front-load contracts are subscription revenue with switching costs. A 60-month auto-renewing contract with $250 per month per container across 1,500 commercial containers produces $4.5M of contracted ARR.
Two structural advantages drive the highest waste hauling business valuation outcomes. The first is front-load commercial contract revenue. The second is internalized disposal. Operators that combine both routinely command 9x to 11x EBITDA, even at $5M to $15M EBITDA scale.
- Front-load contracts are subscription revenue with switching costs. A 60-month auto-renewing contract with $250 per month per container across 1,500 commercial containers produces $4.5M of contracted ARR. Renewal rates exceed 90% per Waste Business Journal benchmark data, because changing haulers requires container swap-out logistics, billing system changes, and operational disruption that most facility managers avoid.
- Internalization compresses the operating-cost line that competitors pay as a variable expense. If your competitor pays $65 per ton in third-party tip fees on 200,000 tons annually, that is $13M of disposal cost. If you own the transfer station or landfill and internalize 60% of that tonnage, you capture roughly $7.8M of revenue that was previously a third-party cost. At a 35% transfer-station margin or 45% landfill margin, that is $2.7M to $3.5M of incremental EBITDA on the same tonnage.
- Internalization is also a defensive moat. If your transfer station is the only short-haul disposal option within 60 miles, every competing hauler in that radius must either pay you for disposal access or absorb a long-haul cost premium of $8 to $15 per ton. Capstone Partners’ 2025 environmental services M&A report cites this as one of the durable structural advantages in waste collection.
- Density compounds margin. Adding the 26th front-load contract to an existing route is margin-accretive because the truck is already on the street. The marginal cost of an additional lift is about $4 to $7 per stop versus the marginal revenue of $90 to $250 per month. This is why route-density math drives valuation: more lifts per hour means lower cost per lift means higher EBITDA margin.
- Defensive against price-only competition. A vertically integrated operator can price 5% to 10% below an unintegrated competitor and still earn equal or better gross margin, because the disposal cost line is internalized.
If you are primarily a residential or roll-off operator considering a sale, the highest-ROI 2 to 4 year investment is converting the sales motion toward commercial front-load, and acquiring or partnering for transfer-station capacity in your operating MSA.
How buyers actually calculate waste hauling business valuation
Normalize the EBITDA. Adjust for owner compensation, related-party transactions, personal vehicle expenses, family member payroll, and any deferred truck or container replacement that should be capex rather than maintenance expense. Decompose the revenue stream. Split by sub-category (residential, front-load, roll-off, transfer-station third-party, MRF commodity revenue, special-waste, construction debris) and within each, by contract type (open subscription, multi-year commercial contract, municipal franchise). Rebuild the route-density model. Pull GPS or telematics data.
- Normalize the EBITDA. Adjust for owner compensation, related-party transactions, personal vehicle expenses, family member payroll, and any deferred truck or container replacement that should be capex rather than maintenance expense.
- Decompose the revenue stream. Split by sub-category (residential, front-load, roll-off, transfer-station third-party, MRF commodity revenue, special-waste, construction debris) and within each, by contract type (open subscription, multi-year commercial contract, municipal franchise).
- Rebuild the route-density model. Pull GPS or telematics data and calculate lifts per hour by route. Front-load benchmark: 25 to 35 lifts per hour in dense urban markets, 15 to 22 in suburban, 8 to 12 in rural. Below benchmark means latent margin opportunity for the buyer. Above benchmark means the route is already optimized.
- Quantify the internalization rate. Calculate the tonnage internalized at owned transfer or landfill assets versus the tonnage paying third-party tip fees. A 40%+ internalization rate is platform-grade. Under 15% is unintegrated.
- Stress-test the recycling commodity exposure. If MRF revenue is more than 10% of EBITDA, the buyer will model the recycling commodity cycle (OCC, mixed paper, aluminum, PET) at three scenarios: trough, mid-cycle, peak. The valuation typically anchors on mid-cycle pricing.
- Apply the concluding multiple. Cross-checked against WCN, GFL, CWST, RSG, WM public comparables (adjusted down for private-company illiquidity discount of typically 20% to 30%) and recent private transaction comparables.
How do route density economics affect lifts per hour and stops per hour?
Route density is the single largest operating-margin lever in waste hauling, and buyers in waste hauling business valuation work rebuild the route model in diligence. The math is straightforward and unforgiving.
Route density is the single largest operating-margin lever in waste hauling, and buyers in waste hauling business valuation work rebuild the route model in diligence. The math is straightforward and unforgiving.
Front-load lifts per hour
A front-load driver on a typical 10-hour day produces between 80 and 280 lifts depending on density. The benchmark distribution per Waste Business Journal route-productivity surveys:
- Dense urban (downtown, dense commercial corridor): 25 to 35 lifts per hour, 250 to 350 lifts per 10-hour day.
- Suburban commercial: 15 to 22 lifts per hour, 150 to 220 lifts per day.
- Rural / spread commercial: 8 to 12 lifts per hour, 80 to 120 lifts per day.
At a fully loaded cost of $400 to $550 per truck-day (driver wages plus benefits, fuel, maintenance, depreciation, insurance) per the National Solid Wastes Management Association cost-of-service surveys, the breakeven per lift is roughly $2 to $4 depending on density. Operators running below benchmark have a real-time margin problem. Operators running above benchmark have either optimized their routing or they are running drivers too hard with productivity-safety tradeoffs that buyers will probe in diligence.
Residential stops per hour
Automated side-load trucks (one-person crews) run 120 to 180 stops per hour in dense suburban routes. Rear-load trucks with two-person crews run 80 to 130 stops per hour. The benchmark for a profitable automated route is 1,000 to 1,500 single-family homes per truck-day.
Roll-off stops per day
Roll-off is a different productivity metric: it is hauls per day, not lifts per hour. Benchmark: 12 to 16 hauls per day per truck in dense urban construction markets, 8 to 12 in suburban, 5 to 8 in rural. Revenue per haul of $400 to $900 plus the disposal tip fee (passed through to customer or absorbed at lower price points).
How do internalization rate and tip-fee economics impact valuation?
Tip fees are the single largest variable cost in waste collection, and the internalization rate (percentage of tonnage disposed at owned facilities versus paying third-party) drives a 1x to 2x EBITDA multiple premium. National average tip fees in 2024 were $59.56 per ton per the Environmental Research & Education Foundation’s annual landfill survey.
Tip fees are the single largest variable cost in waste collection, and the internalization rate (percentage of tonnage disposed at owned facilities versus paying third-party) drives a 1x to 2x EBITDA multiple premium.
National average tip fees in 2024 were $59.56 per ton per the Environmental Research & Education Foundation’s annual landfill survey. Regional ranges:
- Northeast (NY, NJ, CT, MA): $95 to $135 per ton, driven by landfill scarcity and waste-export volume.
- Mid-Atlantic and Southeast (PA, MD, VA, NC, FL): $50 to $75 per ton.
- Midwest (OH, MI, IN, IL): $40 to $60 per ton.
- South Central (TX, OK, LA): $30 to $50 per ton.
- Mountain West (AZ, NM, CO, UT): $25 to $45 per ton.
- West Coast (CA, OR, WA): $55 to $95 per ton, with California higher due to state waste-export restrictions and AB 939 diversion requirements.
For a 200,000-ton-per-year hauler in the Mid-Atlantic, the disposal cost line at $65 average tip fee is $13M annually. If that hauler internalizes 50% of tonnage at an owned transfer station that long-hauls to a third-party landfill at $42 per ton (transfer + long-haul), the effective cost drops to $54M-equivalent revenue captured internally plus reduced cost per ton on the internalized half. The EBITDA capture from 50% internalization on a 200,000-ton book typically ranges from $1.5M to $3M in additional EBITDA at the hauler-plus-transfer level.
Why do landfill access and EPA Subtitle D compliance matter?
Owning Subtitle D landfill capacity is the most valuable asset in waste hauling, and it is also the rarest in private-company transactions because new landfill permits have been functionally impossible to obtain in most US states since the 1990s. The Resource Conservation and Recovery Act (RCRA) Subtitle D regulations (40 CFR Part 258) impose composite liner requirements, leachate collection systems, groundwater monitoring, gas collection, and 30-year post-closure care obligations.
Owning Subtitle D landfill capacity is the most valuable asset in waste hauling, and it is also the rarest in private-company transactions because new landfill permits have been functionally impossible to obtain in most US states since the 1990s. The Resource Conservation and Recovery Act (RCRA) Subtitle D regulations (40 CFR Part 258) impose composite liner requirements, leachate collection systems, groundwater monitoring, gas collection, and 30-year post-closure care obligations. The capital cost to develop a single Subtitle D cell is typically $400K to $700K per acre depending on geology and regulatory state.
The practical consequence: existing permitted landfill capacity is a finite, durable, appreciating asset. WM, Republic, Waste Connections, GFL, and Casella each own portfolios of long-tail Subtitle D landfills (collectively over 400 operating landfills across the five companies per their respective 10-K and 20-F filings) that anchor their integrated business models. Private regional consolidators that own one or two landfills inside their operating MSA trade at 10x to 13x EBITDA because the landfill is irreplaceable and provides decades of remaining airspace.
If you do not own landfill capacity but you operate in a market with landfill scarcity (Northeast, parts of California, parts of Florida), your transfer-station capacity becomes a partial substitute. Transfer stations are the consolidation point between the local hauling fleet and the long-haul to disposal. Operators that own the transfer station capture the consolidation margin and shield themselves from disposal-market pricing volatility.
How do CDL driver labor shortage and wage inflation affect margins?
CDL Class B driver shortage is the largest cost-side risk in waste hauling business valuation. The American Trucking Associations’ 2024 driver shortage report estimated an 80,000-driver shortfall industry-wide, with waste collection competing against long-haul trucking, construction, and delivery for the same Class B labor pool.
CDL Class B driver shortage is the largest cost-side risk in waste hauling business valuation. The American Trucking Associations’ 2024 driver shortage report estimated an 80,000-driver shortfall industry-wide, with waste collection competing against long-haul trucking, construction, and delivery for the same Class B labor pool.
BLS Occupational Employment Statistics May 2024 data (most recent available as of mid-2026) reported the following median hourly wages for refuse and recyclable material collectors (SOC 53-7081):
- National median: $22.84 per hour ($47,500 annual), up from $20.15 per hour in May 2022 (13.4% wage inflation over two years).
- Top quartile metros (NYC, San Francisco, Seattle, Boston): $28 to $35 per hour.
- Bottom quartile metros (rural South, parts of Texas): $17 to $20 per hour.
Layer in benefits (typically 25% to 35% of base wages for full-time drivers with health, dental, 401(k) match, and workers’ comp) and the fully loaded labor cost per driver-hour runs $30 to $48. On a 10-hour route day, that is $300 to $480 per truck-day in driver labor alone.
The implications for valuation:
- Wage inflation eats margin if not passed through in contract pricing. Commercial contracts without CPI or fuel-and-labor escalators are a hidden margin drain. Buyers price this risk into the multiple.
- Driver turnover above 30% annually is a yellow flag. National turnover in solid-waste collection runs 18% to 25% per industry surveys. Above 30% suggests pay, route design, or culture problems that the buyer will need to fix.
- Automated side-load conversion reduces labor per stop. One-person automated routes versus two-person rear-load is the single largest labor-cost reduction available in residential collection.
What is the impact of CNG fleet conversion and container economics?
Compressed natural gas (CNG) fleet conversion has been the largest fleet-decision question in waste hauling for the past decade. The economics turn on three variables: diesel-to-CNG price spread, CNG fueling infrastructure access, and incremental truck cost. CNG truck premium: roughly $40K to $55K per truck above the diesel-equivalent base price per OEM (Mack, Peterbilt, Autocar, McNeilus) published configurations.
Compressed natural gas (CNG) fleet conversion has been the largest fleet-decision question in waste hauling for the past decade. The economics turn on three variables: diesel-to-CNG price spread, CNG fueling infrastructure access, and incremental truck cost.
- CNG truck premium: roughly $40K to $55K per truck above the diesel-equivalent base price per OEM (Mack, Peterbilt, Autocar, McNeilus) published configurations.
- Fueling infrastructure: a single-station CNG facility for a fleet of 50+ trucks costs $1.5M to $3M to install. Third-party retail CNG is available in major metros at typically $2.20 to $2.80 per diesel-gallon-equivalent (DGE) versus diesel at $3.50 to $4.50 per gallon (June 2026 EIA data).
- Operating-cost savings: $0.30 to $0.80 per mile depending on fuel-price spread. On a 100-mile-per-day truck, $30 to $80 in daily fuel savings, or $7,500 to $20,000 annually per truck. Payback on the truck premium plus infrastructure is typically 4 to 6 years at fleet sizes above 25 to 30 trucks.
- Buyer view: CNG fleets are valued positively when paired with owned fueling infrastructure. CNG fleets dependent on third-party retail CNG without contracted pricing are valued neutrally. WM, Republic, and Waste Connections collectively operate over 13,000 CNG trucks per their respective sustainability reports, signaling that the technology is mature and proven at scale.
Container fleet cost
Container assets are a meaningful balance-sheet line. Benchmark pricing per Wastequip, MetalFab, and Galbreath published price lists (2025-2026):
- Front-load dumpsters: $800 to $1,200 per yard of capacity. A 4-yard front-load container: $3,200 to $4,800.
- Roll-off open-top containers: $1,800 to $3,500 per yard. A 30-yard roll-off: $4,500 to $9,000.
- Compactors (stationary or self-contained): $15K to $45K per unit depending on size and load type.
An operator with 3,000 front-load containers (average 4-yard) plus 250 roll-off containers represents roughly $9M to $15M of container asset value at replacement cost. Buyers look for documented container audits with serial numbers, locations, and condition grading.
How does MRF integration and single-stream recycling commodity exposure affect valuation?
Single-stream recycling (mixed paper, cardboard, plastic, glass, metal collected in one bin and sorted at an MRF) is both an asset and a risk for waste haulers. The asset: MRFs are capital-intensive infrastructure that generates throughput-based revenue and commodity-sale revenue. The risk: MRF profitability depends on commodity pricing for recovered fiber, plastic, and metal, which is volatile.
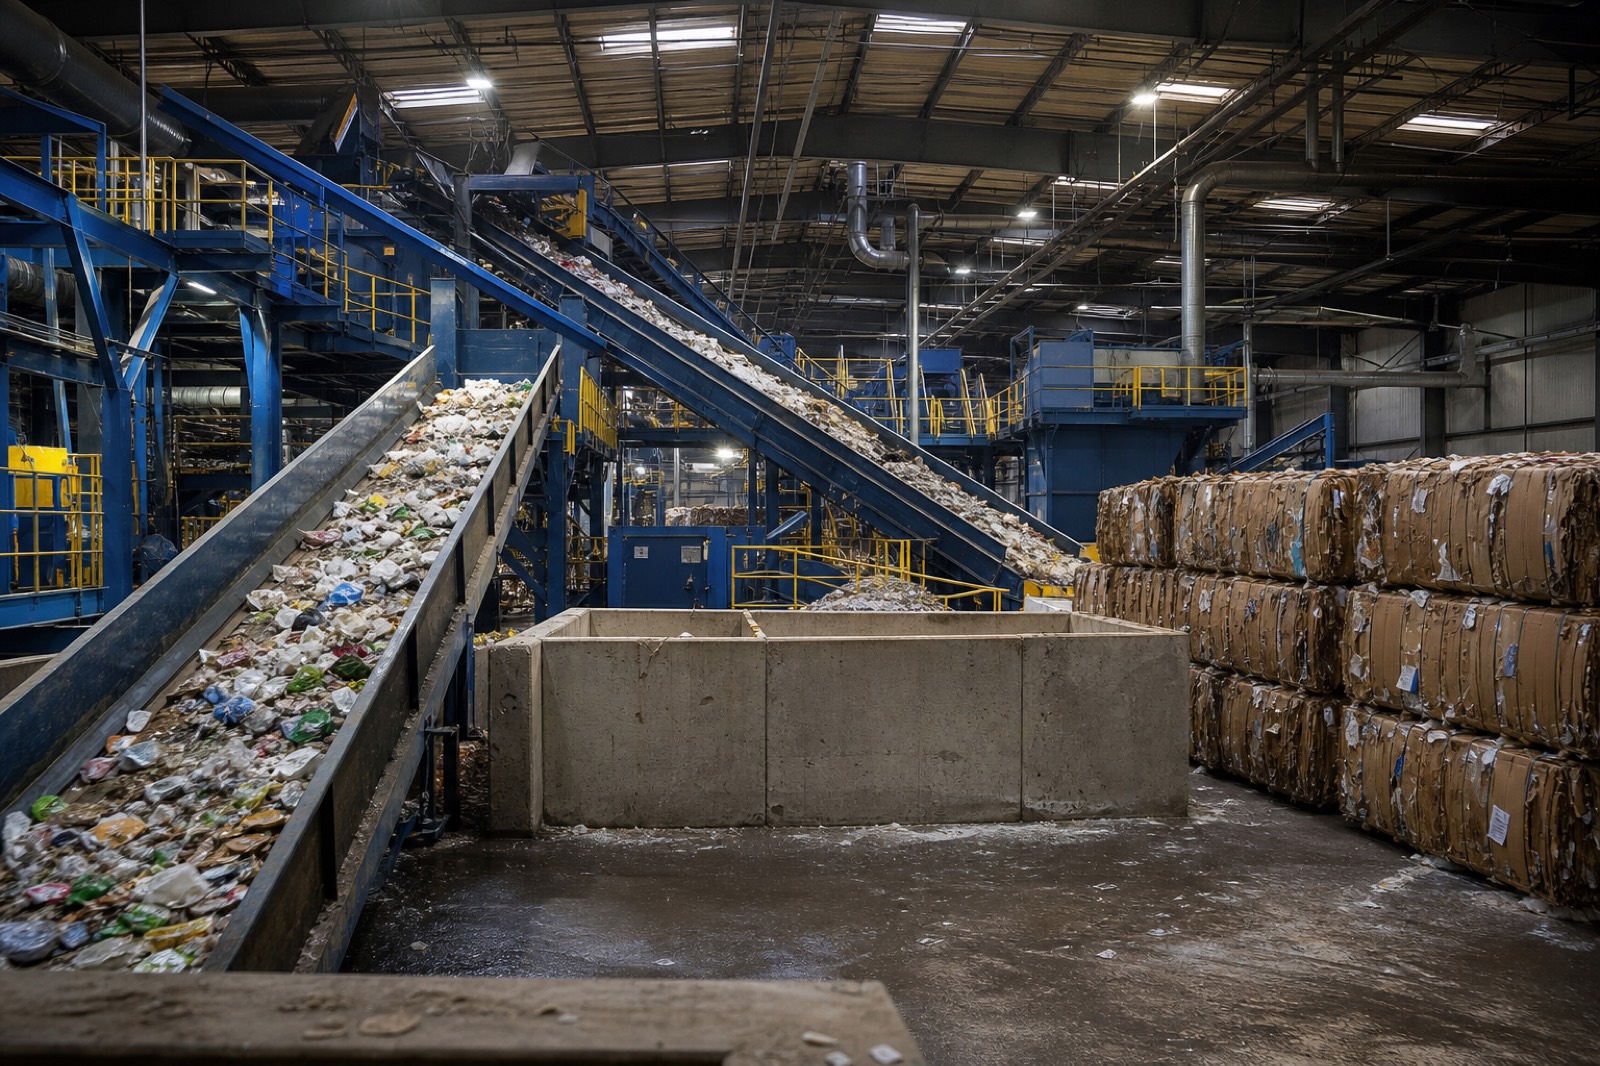
Single-stream recycling (mixed paper, cardboard, plastic, glass, metal collected in one bin and sorted at an MRF) is both an asset and a risk for waste haulers. The asset: MRFs are capital-intensive infrastructure that generates throughput-based revenue and commodity-sale revenue. The risk: MRF profitability depends on commodity pricing for recovered fiber, plastic, and metal, which is volatile.
2024-2026 indicative commodity pricing per Recycling Markets and Waste Dive composite indexes:
- Old corrugated cardboard (OCC): $80 to $180 per ton, recovered from cardboard-heavy commercial routes.
- Mixed paper: $30 to $85 per ton, lower-value fiber stream.
- Aluminum used beverage cans (UBC): $1,400 to $1,850 per ton, the highest-value recovered material.
- PET (water and soda bottles): $350 to $650 per ton.
- HDPE (milk jugs, detergent bottles): $300 to $750 per ton.
- Mixed glass: typically negative-value or breakeven; many MRFs landfill glass.
The valuation treatment: buyers anchor on mid-cycle commodity pricing for MRF EBITDA, not peak. Operators that booked 2021-2022 peak-cycle MRF EBITDA into their headline numbers get a haircut. Operators that have processing fees built into their commercial recycling contracts (a per-ton handling fee paid by the generator regardless of commodity value) get credit because the processing fee de-risks the commodity exposure.
What are the six factors that move waste hauling business valuation multiples?
1. Front-load commercial contract mix
The single largest valuation driver in waste hauling business valuation. A business at 65%+ commercial front-load with multi-year contracts, CPI escalators, and 90%+ renewal trades at 8x to 10x. A primarily residential or roll-off business at the same EBITDA trades at 5.5x to 7.5x. This is a 2 to 3 turn differential, worth $6M to $9M on a $3M EBITDA business.
2. Internalization rate
Tonnage internalized at owned transfer stations or landfills. Above 40% internalization adds 1x to 2x to the multiple. Zero internalization (100% third-party tip-fee exposure) caps the multiple at the lower end of the range.
3. Route density (lifts per hour)
Documented GPS or telematics-based route productivity. Front-load at 25+ lifts per hour suggests dense, optimized routes. Residential automated side-load at 130+ stops per hour suggests profitable density. Roll-off at 12+ hauls per day per truck suggests strong cycle time.
4. Contract structure and renewal history
Within commercial front-load, contract quality matters:
- Premium book: 36-to-60-month contracts, auto-renewal, CPI + fuel + labor escalators, liquidated damages clauses, 90%+ historical renewal, top-10 customers under 25% of revenue.
- Good book: 24-to-36-month contracts, some escalators, 85% to 90% renewal, top-10 under 35%.
- Average book: 12-month or month-to-month, no escalators, 80% to 85% renewal.
- Weak book: open-ended subscription, no formal contract, no escalators, high concentration.
5. Franchise or exclusive municipal contracts
Exclusive franchise markets (most of California per state PRC code, parts of Washington and Oregon under state procurement law, and pockets of New England) award 5 to 10 year exclusive contracts with right-of-first-refusal renewal. These contracts are durable revenue with municipal credit risk, and they add 0.5x to 1.5x to the multiple.
6. Disposal capacity and permit position
Owned Subtitle D landfill capacity is the most valuable single asset. Even partial transfer-station ownership in markets with landfill scarcity provides a structural moat. Buyers look for at least 20 years of remaining permitted airspace at current intake rates, with active dialogue with state environmental agencies on vertical expansions or lateral expansions.
How would you value a $3M EBITDA Pennsylvania waste hauling business?
Business profile:
- $15M revenue, $3M reported EBITDA (20% margin)
- Operating in greater Pittsburgh / Allegheny County, PA
- Mix: 75% commercial front-load (1,650 active containers across 850 commercial accounts), 25% roll-off (60 containers, primarily construction and demolition customers)
- Commercial contract book: 850 customers, average contract length 30 months, 87% annual renewal, CPI escalators in 60% of contracts, top-10 customers represent 28% of revenue (largest single customer: 6%)
- Fleet: 22 front-load trucks (CNG, 5-year average age), 8 roll-off trucks (diesel, 4-year average age)
- Disposal: no internalization. All tonnage tipped at Republic Services’ Imperial Landfill in Imperial, PA at ~$58 per ton 2025 rate, plus partial volume to a Waste Management transfer station at $52 per ton
- Annual tonnage: 75,000 tons across front-load and roll-off
- Annual disposal spend: ~$4.2M (representing 28% of revenue and the largest cost line after labor)
- CDL Class B drivers: 32 active, average tenure 4.5 years, turnover 19%
- Software: Trux for routing, Soft-Pak for billing
- Owner comp $280K, replacement GM cost $185K. Personal expenses $35K. One-time legal/consulting $40K.
EBITDA normalization:
- Reported EBITDA: $3.0M
- Owner compensation adjustment: +$95K (above-market by $95K)
- Personal expenses (vehicle, country club, family payroll): +$35K
- One-time legal and consulting fees: +$40K
- Normalized EBITDA: $3.17M
Multiple assessment:
- Starting benchmark for $3M EBITDA, 75% front-load commercial mix, no internalization: 8.0x
- +0.3x for CNG fleet (owned fueling at company yard, 5-year average age, no near-term replacement cliff)
- +0.2x for documented Trux + Soft-Pak operating systems (clean data, easy buyer integration)
- +0.2x for strong driver tenure (4.5 years average, 19% turnover below industry average)
- -0.4x for zero disposal internalization (100% third-party tip-fee exposure)
- -0.2x for customer concentration (top-10 at 28%, top-1 at 6%)
- -0.1x for contract structure (only 60% of contracts have CPI escalators; remaining 40% are price-fixed)
- Concluding multiple: 8.0x
Indicative valuation: $3.17M x 8.0x = $25.4M
18-month improvement path:
- Reprice the 40% of commercial contracts without CPI escalators to add escalators at renewal: incremental $180K EBITDA, multiple to 8.2x. Outcome: $27.5M.
- Acquire or partner for transfer-station capacity in the Pittsburgh metro to internalize 30% of tonnage: incremental $450K EBITDA, multiple to 8.6x. Outcome: $31.5M.
- Reduce top-10 concentration through targeted growth in mid-sized commercial: multiple to 8.4x at base internalization. Outcome: $26.6M.
- Combined path (reprice + 30% internalization + concentration reduction): normalized EBITDA $3.8M at 8.9x multiple. Outcome: $33.8M.
$8.4M delta over 18 months of preparation. The internalization step is the largest single lever and the hardest to execute, because transfer-station acquisition or development requires capital (typically $4M to $10M) and 12 to 24 months of permitting.
How to increase your waste hauling business value before selling
Highest ROI
- Reprice commercial contracts to add CPI, fuel, and labor escalators. Most front-load books have at least 30% to 50% of contracts without escalators. Adding escalators at the next renewal cycle is the highest-margin improvement available.
- Convert open-subscription residential to formal contracts. Even 12-month subscription agreements with clear pricing and term improve buyer-perceived recurring revenue quality.
- Document the route-density model. Pull GPS data, calculate lifts per hour, stops per hour, hauls per day by route. A buyer will rebuild this in diligence; presenting it clean accelerates the process and supports the multiple.
- Acquire or partner for transfer-station capacity. The single largest multiple-expansion move available. 18 to 36 month lead time including permitting.
- Hire a GM and transition the largest commercial accounts to a dedicated account manager. Founder-relationship-only accounts are a post-close retention risk that buyers price into the multiple.
Medium ROI
- Implement Trux, AMCS, or Soft-Pak if not already on a waste-specific ERP.
- Document the H-2A or domestic driver workforce and retention program.
- Refresh the front-load and roll-off container audit (serial numbers, locations, condition grading).
- Reduce top-10 customer concentration through targeted mid-market commercial growth.
- Convert remaining diesel routes to CNG if owned fueling infrastructure exists.
Lower ROI
- Website redesign.
- Brand refresh.
- Adding new low-margin service lines (porta-john, document shredding) without scale.
What common mistakes destroy waste hauling business valuation?
Below-market commercial contracts not repriced in 3+ years. Diesel, labor, disposal, and equipment costs have all inflated faster than locked-in contract pricing. Margin erosion is a latent issue buyers will quantify. Aggressive classification of one-time roll-off jobs as recurring. Construction debris hauls are project revenue; buyers will reclassify and rebuild the recurring-revenue base. Booking peak-cycle MRF commodity revenue as run-rate EBITDA. Buyers normalize MRF EBITDA to mid-cycle commodity pricing.
- Below-market commercial contracts not repriced in 3+ years. Diesel, labor, disposal, and equipment costs have all inflated faster than locked-in contract pricing. Margin erosion is a latent issue buyers will quantify.
- Aggressive classification of one-time roll-off jobs as recurring. Construction debris hauls are project revenue; buyers will reclassify and rebuild the recurring-revenue base.
- Booking peak-cycle MRF commodity revenue as run-rate EBITDA. Buyers normalize MRF EBITDA to mid-cycle commodity pricing. Operators that built valuation expectations off 2021-2022 OCC peaks face material disappointment.
- Deferred container or fleet capex. Aging trucks and worn containers are a direct purchase-price deduction. Document the replacement schedule and execute against it.
- Undocumented landfill or transfer airspace position. Buyers will independently verify remaining permitted airspace with state environmental agencies. Surprises in diligence kill deals.
- Owner-only commercial relationships. Post-close retention is a real risk. Top-5 commercial accounts should have dedicated account-manager touchpoints documented for at least 12 months pre-sale.
- Hidden environmental liabilities. Closed landfills, transfer-station historical contamination, fueling-tank historical leaks. Environmental Phase I and Phase II reviews surface these in diligence. Address them proactively or budget for remediation in the deal economics.
Want to know what your waste hauling business is actually worth?
Benchmarks give you a range. A 15-minute confidential call gives you a real number, based on what active buyers are paying right now and which ones would compete for your business. No cost, no obligation.
How do you get a valuation for your waste hauling business?
CT Acquisitions offers confidential waste hauling business valuation for founders evaluating exit timing or buyer fit. We specialize in commercial front-load and integrated regional operators in the $500K to $10M EBITDA range. No fee to you on buy-side introductions; sell-side mandates are paid on success at closing. Visit our waste hauling seller hub or book a 15-minute conversation .
CT Acquisitions offers confidential waste hauling business valuation for founders evaluating exit timing or buyer fit. We specialize in commercial front-load and integrated regional operators in the $500K to $10M EBITDA range. No fee to you on buy-side introductions; sell-side mandates are paid on success at closing. Visit our waste hauling seller hub or book a 15-minute conversation.

About the Author
Christoph Totter is the founder of CT Acquisitions, an M&A advisory firm working both sides of the table, headquartered in Sheridan, Wyoming. We work directly with 500+ buyers, search funders, family offices, lower middle-market PE, and strategic consolidators, including direct mandates with the largest waste consolidators that other intermediaries cannot access. No fee to you on buy-side introductions; sell-side mandates are paid on success at closing. Connect on LinkedIn · Get in touch
Sources and references
Every multiple range, route-productivity benchmark, tip-fee figure, and labor-wage citation on this page is sourced to a published industry research publisher, an SEC filing, a federal statistical source, or CT Acquisitions’ internal benchmark dataset. WM (NYSE: WM) , Stericycle acquisition close press release November 4, 2024, $7.2B at approximately 11x post-synergy EBITDA. investors.wm.com Waste Connections (NYSE: WCN) , 2024 10-K Annual Report and 2025 quarterly filings. GFL Environmental (NYSE: GFL).
Every multiple range, route-productivity benchmark, tip-fee figure, and labor-wage citation on this page is sourced to a published industry research publisher, an SEC filing, a federal statistical source, or CT Acquisitions’ internal benchmark dataset.
- WM (NYSE: WM), Stericycle acquisition close press release November 4, 2024, $7.2B at approximately 11x post-synergy EBITDA. investors.wm.com
- Waste Connections (NYSE: WCN), 2024 10-K Annual Report and 2025 quarterly filings.
- GFL Environmental (NYSE: GFL), 2024 20-F Annual Report.
- Republic Services (NYSE: RSG), 2024 10-K and 2025 quarterly filings.
- Casella Waste Systems (NASDAQ: CWST), 2024 10-K and 2025 quarterly filings.
- Environmental Research & Education Foundation (EREF), “2024 MSW Landfill Operation and Tip Fee Survey” (2024 national average tip fee $59.56/ton).
- Bureau of Labor Statistics Occupational Employment Statistics, SOC 53-7081 Refuse and Recyclable Material Collectors, May 2024 release.
- American Trucking Associations, “2024 Driver Shortage Report.”
- Waste Business Journal, “2025 Waste Industry Statistics & Trends Report.”
- Capstone Partners, “Environmental Services M&A Coverage Report 2025.”
- EPA RCRA Subtitle D regulations (40 CFR Part 258), federal landfill design and operation standards.
- U.S. Energy Information Administration (EIA), diesel retail price weekly survey, June 2026 data.
- CT Acquisitions VERIFIED_MULTIPLES dataset, locked-in vertical-specific multiple ranges reconciled against the above sources; updated quarterly.
Last verified: June 24, 2026. Next refresh: quarterly (target 2026-09-24).
Disclaimer: This guide is general valuation framework intelligence, not legal, tax, accounting, or transaction advice. CT Acquisitions is an M&A advisor working both sides of the table.
Frequently asked questions about waste hauling business valuation
What is the average waste hauling business multiple in 2026?
Across private-company transactions, simple-average waste hauling business valuation runs 6.5x to 8.5x EBITDA. Front-load commercial operators with multi-year contracts trade at 7x to 9x. Integrated operators with transfer or landfill capacity trade at 10x to 13x. Sub-$5M EBITDA residential-only or roll-off-only operators trade at 5x to 7x. The sub-category and internalization rate matter more than the headline revenue.
How is a waste hauling business valued?
Revenue decomposition by sub-category (residential, front-load, roll-off, transfer, MRF, special-waste), route-density rebuild (lifts per hour, stops per hour), internalization-rate calculation, commercial contract book quality review, and labor-and-fleet condition assessment. Cross-checked against public comparables (WCN, GFL, CWST, RSG, WM) adjusted for private-company illiquidity.
What is the most valuable type of waste hauling business?
Fully integrated operators that own hauling, transfer stations, MRFs, and EPA Subtitle D landfill capacity in their operating MSA. This profile trades at 10x to 13x EBITDA. Front-load commercial-led operators with partial internalization trade at 9x to 11x. The combination of contracted commercial revenue and owned disposal is the highest-value profile.
How much is a waste hauling business with $3M EBITDA worth?
Front-load commercial-led with no internalization in a mid-Atlantic market: $24M to $27M. Front-load with 30%+ internalization at owned transfer station: $27M to $32M. Residential or roll-off only at $3M EBITDA: $18M to $22M. Exclusive municipal franchise market adds a 0.5x to 1.5x premium on top.
Does owning a transfer station or landfill really change my valuation?
Materially. Internalization rate above 40% adds 1x to 2x to the EBITDA multiple. Owning a Subtitle D landfill in your operating MSA is the single most valuable asset in waste hauling and is functionally irreplaceable because new landfill permits are nearly impossible to obtain in most US states.
What route density should I target for my front-load fleet?
Dense urban commercial: 25 to 35 lifts per hour. Suburban commercial: 15 to 22 lifts per hour. Rural commercial: 8 to 12 lifts per hour. Below benchmark suggests latent margin opportunity (and a valuation discount). Above benchmark suggests optimized routing, which supports the upper end of the multiple range.
Is CNG fleet conversion worth it before selling?
It depends on fleet size and infrastructure. CNG trucks cost $40K to $55K more than diesel equivalents, and fueling infrastructure costs $1.5M to $3M for fleets of 50+ trucks. Payback is typically 4 to 6 years. If your fleet is already 50%+ CNG with owned infrastructure, that is a valuation positive. Converting in the final 12 months pre-sale rarely produces multiple expansion that justifies the capital.
How do buyers evaluate my commercial contract book?
They rebuild it. Every active contract is reviewed for customer, container count and size, monthly revenue, contract term, renewal date, escalator language, liquidated damages clause, and historical pricing actions. Aggregate metrics (weighted average contract length, renewal rate, escalator coverage, top-10 concentration) are calculated and compared to industry benchmarks.
How much should I expect for driver wage inflation in the next 3 years?
CDL Class B driver wages inflated 13.4% from May 2022 to May 2024 per BLS Occupational Employment Statistics. Continued tightness in the Class B labor pool, plus competition from construction and delivery, suggests another 8% to 15% wage inflation over 2026 to 2028 absent a major macro downturn. Build escalators into your commercial contracts to pass this through.
How long does it take to sell a waste hauling business?
90 to 180 days from LOI to close for a well-prepared front-load commercial business. Preparation runway is 12 to 24 months depending on starting position. Environmental Phase I review, landfill or transfer-station airspace verification, and commercial contract book diligence can extend timelines.
How much will I pay in taxes on the sale?
Federal long-term capital gains plus 3.8% NIIT on the goodwill portion. State taxes vary widely (Pennsylvania, for example, taxes capital gains at the 3.07% personal-income-tax rate; California taxes at up to 13.3%). Structural planning (asset vs stock sale, F-reorganization, QSBS where applicable) can reduce effective rate. See our complete selling playbook.
What is the best time of year to sell a waste hauling business?
Most owners prefer to close after the busy construction season for roll-off-heavy businesses (fall) or at fiscal-year-end for front-load-heavy businesses to give the buyer a clean trailing 12 months. LOI timing typically aligns with mid-year; close in fall or winter.
Is a waste management business worth 3 times profit?
For a small owner-operated business, roughly yes. BizBuySell’s benchmarks show the middle half of waste management and recycling businesses sold on its marketplace valued at 2.14x to 3.88x seller’s discretionary earnings. Larger haulers with commercial contracts and route density are priced on EBITDA instead, at 5x and up per the size-band table on this page, because institutional buyers compete for them.
What EBITDA multiple do public waste companies trade at?
Public consolidators trade well above private haulers. Multiples.vc put WM at about 13.1x EBITDA and 4.0x revenue as of September 2026. Private companies sell at a discount to that because they are smaller, less diversified, and usually lack owned landfill capacity. Only platform-grade operators with integrated hauling, transfer, recycling, and landfill assets approach public-company multiples, per the size-band table on this page.
Related resources
- Waste hauling seller hub, state-by-state data
- Environmental services seller hub
- Free valuation survey tool
- How to sell a service business (full playbook)
- Landscaping business valuation
Limitations of this analysis
Industry-data tier multiples are aggregated. Waste Business Journal, Capstone Partners, GF Data, and Resource Recycling all publish blended ranges across regional, mix, and capital-structure differences. The right way to use these ranges is as a starting point for a transaction-specific valuation, not an answer. Public-company comparables include free-float liquidity and growth optionality. WCN, GFL, CWST, RSG, and WM trade higher than private comparables. The typical private-company illiquidity discount is 20%.
- Industry-data tier multiples are aggregated. Waste Business Journal, Capstone Partners, GF Data, and Resource Recycling all publish blended ranges across regional, mix, and capital-structure differences. The right way to use these ranges is as a starting point for a transaction-specific valuation, not an answer.
- Public-company comparables include free-float liquidity and growth optionality. WCN, GFL, CWST, RSG, and WM trade higher than private comparables. The typical private-company illiquidity discount is 20% to 30%, but varies by scale and integration profile.
- Subtitle D landfill capacity is the rarest and most valuable single asset. Operators with even partial landfill ownership in markets with airspace scarcity trade meaningfully above the cited multiple ranges.
- Real estate is valued separately. Owned yards, transfer-station real property, and landfill land are generally valued at appraised value or cap-rate value outside the operating-business multiple.
- This guide is general valuation framework intelligence, not legal, tax, accounting, or transaction advice. Specific operator outcomes depend on deal structure, buyer fit, geography, environmental liability profile, and active negotiation dynamics.
Want a Specific Read on Your Waste Hauling Business?
15 minutes, confidential, no contract, no cost. You leave with a read on your local buyer market and a likely valuation range. Owner-readers ready to act can move to sell-side waste hauling advisory for the sell-side process.
15 minutes, confidential, no contract, no cost. You leave with a read on your local buyer market and a likely valuation range.
Owner-readers ready to act can move to sell-side waste hauling advisory for the sell-side process.