
How to Calculate the Value of a Business: The 5 Formulas Every Owner Should Run
This guide on how to calculate the value of a business walks through the five formulas that buyers, brokers, and appraisers actually use to put a defensible number on a private company. Each formula gets a worked example with real inputs, a printable cheat sheet, and the add-back logic that quietly moves business value by 20% to 40% before the multiple is even applied.
How to Calculate the Value of a Business: The Quick Answer
For 2026 sell a foundation repair business with 60-120 day close, 100+ vetted PE / family office / search fund buyers, Groundworks (Cerberus) thesis, see our reference.
The fastest defensible way to calculate the value of a business is to run two earnings formulas (SDE multiple for owner-operated companies under $1M cash flow, EBITDA multiple for companies above that), a third sanity check (revenue multiple), and reconcile the spread. For most private US small businesses, that triangulation lands within 10% to 15% of the real selling price.
The reason buyers, brokers, and appraisers rarely rely on a single formula is that every formula has a blind spot. SDE under-counts professional management costs. EBITDA over-rewards owners who run a lean P&L. DCF requires forecasting five years into the future with confidence most owners don’t have. Asset value ignores going-concern economics. Revenue multiples lie when margins drift from industry norms. The five-formula triangulation works because the blind spots cancel out: if four of five methods land in the same window, the answer is defensible. If they spread by more than 30%, something is wrong with one of the inputs and it gets investigated before the business goes to market.
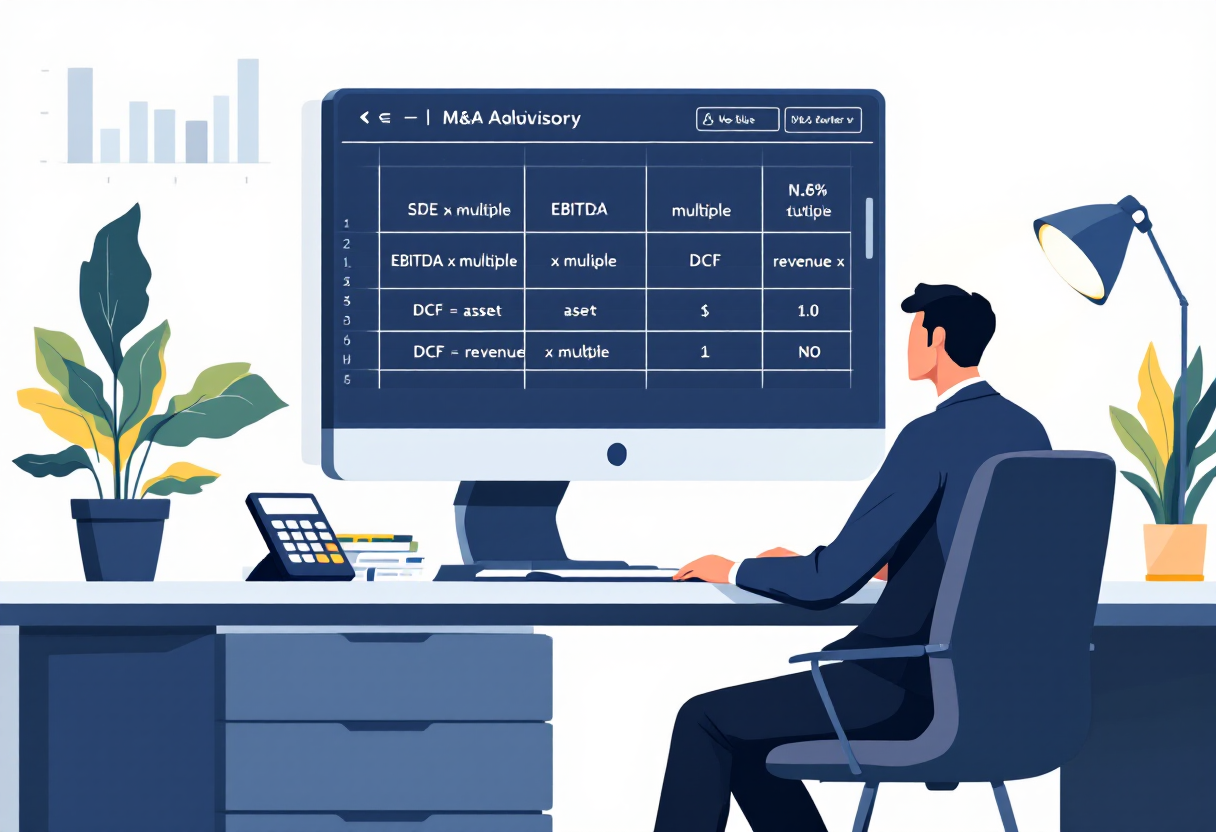
Here are the five formulas in one place:
- SDE x SDE Multiple, for owner-operated businesses with under $1M-$1.5M in cash flow. Multiples typically 2.0x to 4.0x.
- EBITDA x EBITDA Multiple, for businesses with professional management and EBITDA above $1M. Multiples typically 4.0x to 8.0x in the lower middle market.
- DCF (Discounted Cash Flow), sum of projected free cash flows discounted to present value plus a discounted terminal value. Most rigorous, most assumption-sensitive.
- Adjusted Asset Value, fair-market-adjusted assets minus liabilities. Used for asset-heavy, low-cash-flow, or wind-down businesses.
- Revenue x Industry Multiple, quick gut-check, useful only when the multiple comes from a credible recent comp set.
If you only have ten minutes, run formulas 1, 2, and 5, that triangulation alone gets most owners within striking distance of a real number. Then pressure-test against the latest BizBuySell Insight Report and the IBBA Market Pulse to confirm the multiple range matches what the market is actually paying. The rest of this guide unpacks each formula with full worked examples, an industry multiple chart, the most common calculation errors, and an Excel-ready triangulation template.
Formula 1: SDE x Multiple = Business Value
Seller’s Discretionary Earnings (SDE) is the standard cash-flow metric for businesses where one owner does most of the work. SDE answers: how much economic benefit does this business throw off to a single working owner? Per BizBuySell’s industry valuation data, the median Main Street small business sells at roughly 2.5x to 2.7x SDE. The Insight Report quarterly data tables break median multiples down by sector (services, retail, restaurants, manufacturing) and by metro, which is the closest thing the small-business world has to a public-comp database.
The SDE Formula, Step by Step
Start with net income (pre-tax), then add back:
- Owner’s W-2 salary and bonus
- Owner’s payroll taxes
- Owner’s health insurance, auto, phone, travel run through the business
- Interest expense (financing varies by buyer, so it gets normalized out)
- Depreciation and amortization (non-cash)
- One-time/non-recurring expenses (legal settlements, hurricane repair, COVID-era PPP write-offs, etc.)
- Discretionary expenses that wouldn’t continue under a new owner (charitable donations, country club, family member on payroll doing nothing)
The formula:
SDE = Net Income + Owner Comp + Owner Benefits + Interest + Depreciation + Amortization + Non-Recurring + Discretionary
Then:
Business Value = SDE x SDE Multiple
Picking the Right SDE Multiple
SDE multiples are driven by five factors. Use this as your scorecard:
| Driver | Pushes Multiple Down | Pushes Multiple Up |
|---|---|---|
| Owner involvement | Owner is the business (90%+ revenue tied to owner) | Owner works under 20 hrs/week, GM in place |
| Customer concentration | Top customer is 30%+ of revenue | No customer above 10% |
| Recurring revenue | 100% project-based, one-off | 50%+ recurring contracts or subscriptions |
| Growth trajectory | Revenue flat or declining 3 years | 3-year CAGR above 15% |
| Industry tailwind | Print, retail apparel, casual dining | HVAC, MSP, home services, B2B SaaS |
Most independently-owned small businesses with mediocre scores on the table above land at 2.0x to 2.7x SDE. Clean, growing, semi-absentee businesses with recurring revenue trade at 3.0x to 4.0x. Anything above 4.0x usually means the buyer is paying for either strategic value, a hard-to-replicate license, or a thesis-aligned platform acquisition.
For more on the underlying methodology and method comparisons, see the complete business valuation formula methods guide, which goes deeper on the math itself rather than the calculation walkthrough.
Formula 2: EBITDA x Multiple = Enterprise Value
Once a business clears roughly $1M in cash flow and has at least one layer of professional management below the owner, buyers stop using SDE and switch to EBITDA. EBITDA (Earnings Before Interest, Taxes, Depreciation, Amortization) does NOT add back owner compensation, because by definition there is a market-rate executive in the seat and that salary is a real cost of doing business.
The EBITDA Formula, Step by Step
EBITDA = Net Income + Interest + Taxes + Depreciation + Amortization
Then Adjusted EBITDA layers in defensible add-backs:
Adjusted EBITDA = EBITDA + Non-Recurring + One-Time + Owner Excess Comp Above Market + Pro-Forma Synergy (when supportable)
Then:
Enterprise Value = Adjusted EBITDA x EBITDA Multiple
For a deeper walkthrough of what counts and what does not, see our explainer on EBITDA, what it actually measures, and how buyers use it.
Picking the Right EBITDA Multiple
The single biggest driver of EBITDA multiple is size. Corporate Finance Institute, GF Data quarterly reports, and broker survey data converge on roughly the following bands:
| EBITDA Size | Typical Multiple Range | Buyer Type |
|---|---|---|
| Under $1M | 3.0x to 4.5x | Individual + SBA buyers |
| $1M to $2M | 4.0x to 5.5x | Search funds, family offices |
| $2M to $5M | 5.0x to 7.5x | Lower middle market PE |
| $5M to $10M | 6.5x to 9.0x | PE platforms |
| $10M to $25M | 7.5x to 10.0x | PE + strategics |
| $25M+ | 8.5x to 12.0x+ | Strategics, larger PE |
Size premium is real and quantifiable. A $5M EBITDA business does not just sell at 2x the price of a $2.5M EBITDA business, it often sells at 2.5x to 3.0x the price, because the multiple itself expands by roughly 1.0 to 1.5 turns as you cross the $2M and $5M thresholds. That spread is one of the strongest arguments for waiting one more year before going to market if you can credibly project crossing a tier line.
Formula 3: DCF = Sum of Discounted Future Cash Flows
Discounted Cash Flow is the most theoretically pure way to calculate the value of a business: project the future free cash flows, discount each one to today’s dollars using a risk-appropriate rate, add a terminal value, and the sum is intrinsic enterprise value. DCF is the lead method for stable, predictable, asset-light businesses with a defensible 5-year forecast.
The DCF Formula
DCF Value = Sum from t=1 to N of [FCFt / (1 + WACC)^t] + Terminal Value / (1 + WACC)^N
Where:
- FCFt = unlevered free cash flow in year t (EBITDA – taxes on EBIT – capex – change in working capital)
- WACC = weighted average cost of capital (the discount rate)
- Terminal Value = FCF in final year x (1 + g) / (WACC – g), where g is the perpetual growth rate
- N = number of explicit forecast years (typically 5)
WACC for most private US small and lower-middle-market businesses lands between 12% and 22%, meaningfully higher than public-company WACCs because of size, illiquidity, and concentration risk. Aswath Damodaran’s NYU Stern dataset is the standard reference for industry-level cost of capital inputs, and the current-year dataset includes betas, equity risk premia, and country risk premia broken out by sector. For private-company size and illiquidity premia, Kroll’s (formerly Duff and Phelps) Cost of Capital Navigator is the second standard reference.
Terminal growth rate (g) should approximate long-run inflation or nominal GDP, typically 2.0% to 3.0%. Anything above 3% implies the business will eventually outgrow the entire economy, which is mathematically impossible over an infinite horizon. The Bureau of Economic Analysis GDP series and the FOMC Summary of Economic Projections are the two reference points appraisers use when defending a chosen terminal growth rate to the IRS or to opposing counsel. For a deeper walkthrough including the build-up cost-of-capital method, see how DCF actually works for private companies.
DCF Math, Live
Suppose a manufacturer projects FCF of $1.0M, $1.1M, $1.2M, $1.3M, $1.4M over five years, WACC of 14%, terminal growth of 2.5%.
- PV Year 1: $1.0M / 1.14^1 = $877K
- PV Year 2: $1.1M / 1.14^2 = $846K
- PV Year 3: $1.2M / 1.14^3 = $810K
- PV Year 4: $1.3M / 1.14^4 = $770K
- PV Year 5: $1.4M / 1.14^5 = $727K
- Terminal Value (Year 5): $1.4M x 1.025 / (0.14 – 0.025) = $12.48M
- PV of Terminal Value: $12.48M / 1.14^5 = $6.48M
- DCF Enterprise Value: $877K + $846K + $810K + $770K + $727K + $6.48M = ~$10.5M
Now sanity-check that against the EBITDA method. If Year 1 EBITDA is $1.5M and the multiple in that size band is 6.0x, the EBITDA method spits out $9.0M. DCF says $10.5M. The 15% spread is normal, DCF gives partial credit for projected growth that the trailing EBITDA multiple does not, and that gap is the negotiating room.
Formula 4: Asset Value = Total Assets – Total Liabilities (Adjusted)
Asset-based valuation is the right lead method only in three cases: (1) the business is being wound down, (2) the business is asset-heavy with low or zero cash flow (manufacturing with $8M of equipment but a $300K loss), or (3) the assets are worth more than the going concern (rare, but happens with distressed retail and real-estate-rich operators).
The Adjusted Net Asset Formula
Adjusted Asset Value = FMV of Assets – FMV of Liabilities
“FMV”, fair market value, is the work. Book value on the balance sheet almost never matches reality:
- Inventory: mark down by 10-30% for slow-moving SKUs, obsolescence, or out-of-season stock
- A/R: mark down for anything past 90 days, then mark down again for anyone in collections
- Equipment: mark up or down to auction value, not book net of depreciation
- Real estate: mark to current appraised value, not 1998 acquisition cost
- Goodwill/intangibles on balance sheet: usually written down to zero in an asset valuation (the going-concern value captures real goodwill separately)
- Liabilities: include all off-balance-sheet items, pending litigation, environmental remediation, deferred maintenance, accrued PTO
For owner-operated businesses with healthy cash flow, the asset method almost always understates true business value because it ignores the going-concern premium, the workforce, customer relationships, brand, processes, and earnings power that walk out the door if the business closes. Use it as a floor, not a ceiling.
Formula 5: Revenue x Industry Multiple = Quick Estimate
Revenue multiples are the fastest, dirtiest gut-check formula. They are useful for three reasons: (1) speed, you can run one in 30 seconds, (2) the input (revenue) is almost impossible to fake or manipulate, and (3) for some industries (SaaS, agencies, professional practices), revenue multiples actually correlate tightly to selling price because margins within the industry are narrowly clustered.
The formula:
Business Value = Annual Revenue x Industry Revenue Multiple
Per BizBuySell’s data, revenue multiples across all sectors average 0.67x, with the range typically running from 0.42x to 1.2x depending on industry. The catch: a 0.67x revenue multiple on a $1M revenue business with 20% margins ($670K value) implies an EBITDA multiple of roughly 3.4x, perfectly reasonable. But the same 0.67x applied to a business with 5% margins gives an implied EBITDA multiple of 13.4x, wildly off. Revenue multiples only work when margins match the industry norm. The minute margins diverge, the revenue multiple lies.
That is why we treat the revenue method as a third sanity check, never a lead method. For a deeper dive on revenue-based valuation, see our companion guide on when revenue multiples actually work and when they break.
Worked Example: Calculating Value of a $500K SDE Landscaping Business
Walk through how to calculate the value of a business with a complete worked example. Subject: a residential and commercial landscaping company in Charlotte, NC. Owner-operated, 14 trucks, 32 employees, 8 years in business, 60% residential maintenance contracts and 40% commercial design-and-install. The owner pulls a $120K W-2 and works 50 hours per week as the lead estimator and de-facto operations manager.
Step 1: Reconstruct the P&L
| Line Item | Reported | Adjusted |
|---|---|---|
| Revenue | $3,200,000 | $3,200,000 |
| COGS | $1,920,000 | $1,920,000 |
| Gross Profit | $1,280,000 | $1,280,000 |
| Operating Expenses | $960,000 | $880,000 |
| EBITDA (pre-add-back) | $320,000 | $400,000 |
Add-backs identified: $40K of one-time legal fees from a 2025 vendor dispute, $25K of personal auto and phone, $15K of owner family member payroll for a no-show role. That’s $80K of opex reduction.
Step 2: Calculate SDE
- Adjusted EBITDA: $400,000
- Plus owner W-2: $120,000
- Plus owner payroll taxes: $9,000
- Plus owner health insurance: $14,000
- Plus interest expense: $22,000
- SDE = $565,000
Step 3: Apply SDE Multiple
Profile scoring: owner works 50 hrs/week (drag), top customer 18% of revenue (mild concentration), 60% of revenue is recurring HOA and commercial contracts (positive), 3-year revenue CAGR is 11% (mild positive), strong industry tailwind (home services consolidation). Net: this is a 2.7x to 3.0x business.
- Low end: $565K x 2.7 = $1,525,500
- High end: $565K x 3.0 = $1,695,000
Step 4: Cross-Check With Revenue Multiple
Landscaping revenue multiples per BizBuySell sit around 0.50x to 0.65x. Apply 0.55x: $3.2M x 0.55 = $1,760,000. That is at the high end of our SDE range, which makes sense, this business has above-industry-average margins (12.5% EBITDA vs. 8-10% industry).
Step 5: Land the Number
Triangulated business value: $1.55M to $1.70M. Mid-point $1.625M. That is the number to take to market, with the high end as the ask and the low end as the walk-away floor.
What the Asset Method Says (For Reference)
The landscaping business has $480K of equipment (trucks, mowers, skid steers) at fair market value, $145K of A/R, $30K of inventory, and $210K of liabilities (truck loans, line of credit). Adjusted asset value: $480K + $145K + $30K, $210K = $445K. That confirms the SDE-method number is a real going-concern premium of roughly $1.18M, money the new owner is paying for the customer book, the brand, the crew, the contracts, and the cash-flow stream. If a buyer ever argues “I’ll just buy used trucks and start my own,” the $1.18M premium is the answer for what the contracts and the crew are actually worth.
Worked Example: Calculating Value of a $3M EBITDA Manufacturing Business
Different size, different formula stack. Subject: a precision metal fabrication shop in Ohio. $18M revenue, professional GM in place, owner works 25 hrs/week.
Step 1: Calculate Adjusted EBITDA
| Line Item | Amount |
|---|---|
| Net Income | $1,650,000 |
| Plus Interest | $280,000 |
| Plus Taxes | $520,000 |
| Plus Depreciation | $450,000 |
| Plus Amortization | $0 |
| EBITDA | $2,900,000 |
| Plus Non-Recurring (one-time ERP implementation) | $120,000 |
| Plus Owner Excess Comp (over $250K market) | $80,000 |
| Adjusted EBITDA | $3,100,000 |
Step 2: Apply EBITDA Multiple
Profile: $3.1M EBITDA puts this squarely in the $2M-$5M PE-target band. Manufacturing with proprietary tooling, no customer above 12% of revenue, 22% EBITDA margin (above industry norm of 14-16%), modern equipment, semi-absentee owner. This profile typically trades at 5.5x to 7.0x in 2026.
- Low: $3.1M x 5.5 = $17,050,000
- High: $3.1M x 7.0 = $21,700,000
Step 3: DCF Cross-Check
Run a 5-year forecast with $3.1M EBITDA growing 5% per year, $400K annual capex, $50K working capital build, 15% WACC, 2.5% terminal growth. The DCF math (similar to Formula 3 above) lands at roughly $19.5M. That sits inside the EBITDA range, a reassuring sign.
Step 4: Land the Number
Triangulated business value: $17.5M to $21.5M enterprise value, before working capital adjustments and debt. Ask price for the teaser: $20.5M. That gives room for buyer haircuts during diligence without falling below the floor.
What Happens at the Tier Boundary
Here is a real-money observation that owners on the $2M to $5M EBITDA fence almost never get told: every additional turn of multiple is worth $3.1M of cash to the seller on this deal. Pushing from a 5.5x to a 6.5x multiple by tightening customer concentration, hardening the GM in place, and documenting 18 months of clean growth is worth roughly $3M of additional purchase price. The work to harden those drivers typically costs $80K to $150K (consultants, sales reorganization, financial reporting upgrades). The math on doing that work versus walking it to market as-is is rarely close.
Industry Multiple Quick-Reference Chart (Top 25 Industries)
The single most expensive mistake amateur valuators make is applying the wrong multiple to the right earnings. The following ranges are blended from BizBuySell’s Insight Report, IBBA Market Pulse, BVR DealStats, Pitchbook, and our own closed-deal dataset. Use the low end for declining or marginal businesses, the high end for clean growth stories at the top of size band.
| Industry | SDE Multiple | EBITDA Multiple | Revenue Multiple |
|---|---|---|---|
| HVAC Services | 2.5x to 3.5x | 4.5x to 8.0x | 0.55x to 0.90x |
| Plumbing Services | 2.5x to 3.5x | 4.5x to 7.5x | 0.55x to 0.85x |
| Electrical Contracting | 2.3x to 3.3x | 4.0x to 7.0x | 0.45x to 0.80x |
| Roofing | 2.2x to 3.2x | 3.8x to 6.5x | 0.40x to 0.75x |
| Landscaping | 2.3x to 3.0x | 4.0x to 6.5x | 0.50x to 0.80x |
| Pest Control | 3.0x to 4.5x | 5.5x to 9.0x | 1.0x to 2.0x |
| Manufacturing (general) | 2.5x to 3.5x | 5.0x to 7.5x | 0.55x to 1.10x |
| Distribution / Wholesale | 2.2x to 3.2x | 4.5x to 7.0x | 0.30x to 0.60x |
| Construction (specialty) | 2.0x to 3.0x | 4.0x to 6.5x | 0.30x to 0.55x |
| SaaS (small) | n/a | n/a | 3.0x to 6.0x ARR |
| Marketing / Digital Agency | 2.0x to 3.5x | 4.0x to 7.0x | 0.65x to 1.50x |
| Accounting Practice | 2.5x to 3.5x | 4.5x to 6.5x | 0.95x to 1.30x |
| Law Firm | 1.5x to 2.5x | 3.0x to 5.0x | 0.50x to 1.20x |
| Medical Practice | 2.0x to 3.5x | 4.0x to 7.0x | 0.50x to 1.20x |
| Dental Practice | 2.5x to 3.5x | 4.5x to 7.5x | 0.65x to 0.85x |
| Veterinary Practice | 3.5x to 5.0x | 6.5x to 12.0x | 1.0x to 2.5x |
| MSP / IT Services | 2.8x to 4.0x | 5.5x to 9.0x | 0.90x to 1.80x |
| E-commerce | 2.5x to 4.0x | 4.0x to 7.0x | 0.60x to 1.40x |
| Restaurant (single unit) | 1.5x to 2.5x | 2.5x to 4.0x | 0.25x to 0.45x |
| Restaurant (multi-unit franchisee) | 2.0x to 3.0x | 4.0x to 6.5x | 0.40x to 0.75x |
| Auto Repair | 2.0x to 3.0x | 3.5x to 5.5x | 0.40x to 0.65x |
| Trucking / Logistics | 2.0x to 3.0x | 3.5x to 5.5x | 0.30x to 0.60x |
| Insurance Agency | 2.5x to 3.5x | 5.0x to 9.0x | 1.5x to 3.0x |
| Self-Storage | n/a | 9.0x to 14.0x | 4.0x to 7.0x |
| RIA / Wealth Management | 3.0x to 4.5x | 6.0x to 10.0x | 2.0x to 3.5x AUM revenue |
For deal-by-deal comp data, the BVR DealStats database remains the gold standard for private company transactions, with Pitchbook covering the upper end of the lower-middle market and middle market. BizMiner publishes industry financial benchmarks down to 6-digit NAICS codes, and the RMA Annual Statement Studies are the lender-side reference set used by SBA underwriters when sizing acquisition loans against industry norms. The Axial lower middle market network publishes a quarterly Top 25 League Table and active-buyer indices that are useful demand-side reads.
Add-Backs to Calculate the True SDE/EBITDA
Add-backs are the single biggest swing factor in private business valuation. A $1M EBITDA business with $300K of legitimate add-backs is really a $1.3M EBITDA business, and at a 6x multiple that’s a $1.8M swing in business value. Below is the canonical add-back checklist.
The Green Light Add-Backs (Buyer Almost Always Accepts)
- Owner W-2 above market salary (for SDE only) or above the cost of a replacement GM (for EBITDA)
- Owner spouse/family salary for no-show or below-market-productivity roles
- Owner health insurance, life insurance, auto, phone
- One-time legal fees from settled disputes
- One-time consulting fees (ERP, COVID restructuring)
- Personal travel and entertainment run through the business
- Personal vehicle lease or mileage
- Charitable donations that the new owner will not continue
- Country club, gym, and personal subscriptions
- Above-market rent to owner-related real estate (normalize to market rent)
The Yellow Light Add-Backs (Defensible With Documentation)
- Closed locations or product lines (with clean P&L for the closed unit)
- Pandemic-related disruption (must show pre- and post-recovery)
- R&D or ad spend the new owner will dial back
- Pro-forma cost synergy from a recent acquisition
- Loss leader contracts the new owner will let lapse
- Unusually high insurance premiums that have since been renegotiated
The Red Light “Add-Backs” (Buyer Will Reject)
- “We could raise prices”, phantom margin
- “We could fire that underperforming employee”, phantom cost
- Recurring “one-time” expenses that show up every year
- Deferred maintenance the business should be spending on
- Speculative pipeline revenue
- Customer wins booked but not yet billing
Industry data from the M&A Source Market Pulse consistently shows that businesses with documented Quality of Earnings (QoE) studies command 0.5x to 1.0x higher multiples than businesses going to market with self-reported add-backs alone, because the QoE puts a CPA’s name behind the number and shortens the buyer’s diligence window. The major QoE providers in the lower middle market include AICPA-credentialed Accredited in Business Valuation (ABV) professionals and NACVA-credentialed Certified Valuation Analysts, both of which require continuing education and adherence to USPAP standards.
How to Build a 5-Formula Triangulation in Excel
You can run all five formulas in a 12-row spreadsheet. Here is the structure that brokers use for sell-side teasers, copy it directly into Excel or Google Sheets.
The Inputs Tab (Rows 1-15)
- Most recent 3 years of revenue (cells B2, B3, B4)
- Most recent 3 years of net income (B5, B6, B7)
- Most recent 3 years of interest, taxes, depreciation, amortization (rows 8-11)
- Total add-backs by year (row 12)
- Selected SDE multiple (B13), EBITDA multiple (B14), revenue multiple (B15)
The Calculation Tab
- Cell C2:
=SUM(B5:B11)+B12, that is your most recent year SDE or EBITDA - Cell C3: SDE-method value =
=C2*B13 - Cell C4: EBITDA-method value =
=(C2-Owner_Comp)*B14 - Cell C5: Revenue-method value =
=B2*B15 - Cell C6: DCF value (separate tab, link the result)
- Cell C7: Asset value (separate tab, link the result)
- Cell C8:
=AVERAGE(C3:C7), the triangulated mid-point - Cell C9:
=MIN(C3:C7), the walk-away floor - Cell C10:
=MAX(C3:C7), the aspirational ask
The DCF Tab (Separate)
5-year FCF projection in row 1, WACC in B2, terminal growth in B3, present value calc for each year (row 4), terminal value (B5), present value of terminal value (B6), total DCF in B7.
Free templates: SCORE publishes a free business valuation template, and the SBA’s existing business buyer guide includes a basic SDE walkthrough, both are reasonable starter spreadsheets if you don’t want to build from scratch.
The One Pivot Table That Makes the Spreadsheet Buyer-Ready
Drop a pivot table at the bottom of the model that summarizes results by method. Method on the rows (SDE, EBITDA, DCF, Revenue, Asset). Three columns: Low, Mid, High. Conditional-format the cells so the highest value is green and the lowest red. Buyers see this and immediately understand: (1) the seller has done the work, (2) the methods triangulate, (3) the ask sits at a sensible point within the spread. Brokers who do not include this table get asked for it; brokers who do not include it and refuse to build it lose buyers to better-prepared listings down the page.
Common Calculation Errors That Throw the Result Off by 30%+
Even with the right formulas, the answer can land 30% or more off true business value because of these recurring mistakes. Pre-emptively running through this checklist saves more renegotiation grief than any other single hour of pre-market work.
Error 1: Using a Single Year of Earnings
A blowout 2024 fueled by a one-time government contract is not the baseline. Use a 3-year weighted average (50% trailing twelve months, 30% prior year, 20% year before that) or a clean trailing-twelve-month only if the trend is stable. Per BizBuySell’s Insight Report, businesses with declining trends almost universally get valued on the most recent (worst) year, not on the historical average.
Error 2: Confusing SDE With EBITDA
SDE adds back owner comp. EBITDA does not. Applying a 5.5x EBITDA multiple to an SDE number doubles up the owner-comp add-back and inflates the answer by 20-40%. Sanity check: if your “EBITDA” is bigger than your gross profit minus rent and a market-rate salary, you are probably looking at SDE.
Error 3: Industry Multiple That’s Two Years Stale
The 2021-2022 rate environment supported EBITDA multiples a full turn above current 2026 levels in most categories. Using a multiple from a 2022 valuation report today overstates value. Always pull from current-year data sources, BizBuySell, IBBA, BVR DealStats, Pitchbook, and reject anything older than 12 months.
Error 4: Ignoring Working Capital
Enterprise value usually assumes a “normal” level of working capital comes with the business. If actual working capital at close is below the trailing-12 average, the buyer claws back the shortfall dollar-for-dollar. A $500K working capital miss is a $500K price reduction. Build the working capital peg into the deal model, not the valuation as an afterthought.
Error 5: Forgetting Owner-Replacement Cost
If the owner currently works 60 hrs/week as CEO, sales lead, and COO, the buyer has to hire two or three people to replace them. That $250K-$400K of incremental cost is a direct hit to ongoing EBITDA, which means the multiple has to come down. Selling-broker math that ignores owner-replacement cost overstates business value by 15-25% on owner-operated businesses.
Error 6: Double-Counting Cash and Debt
Enterprise value is cash-free, debt-free. If a buyer pays 6x EBITDA enterprise value plus assumes $2M of debt and takes $300K of trapped cash, equity value to the seller is enterprise value minus net debt. Mixing those up at the term sheet stage has killed more deals than any other single math error.
Error 7: Using Book Value for Asset-Heavy Businesses
A 12-year-old CNC machine on the balance sheet at $4K of net book value might be worth $80K at auction. Conversely, $200K of inventory marked at cost might be worth $40K if it is 18-month-old fashion. Per IRS Revenue Ruling 59-60, still the foundational guidance on fair-market-value business valuation 65+ years after publication, book value should never be used as a proxy for FMV when more reliable indicators exist.
Error 8: Picking the Multiple Before Calculating Earnings
This one is more common than the previous seven combined. Owners decide they want $5M for the business and back into the math: “I make $1M, so I need a 5x multiple.” Then they go shopping for a comp or a broker who agrees. That is reverse-engineering an answer, not calculating business value. The correct sequence is always: rebuild the P&L, document add-backs, calculate adjusted SDE or EBITDA, then pick the multiple from current-quarter market data and the size band. Letting the desired sale price drive the input numbers is how owners end up listed for 18 months with zero offers.
Error 9: Treating Seller Financing as Equivalent to Cash
An $8M offer with $2M of seller financing at 5% over 7 years is not an $8M offer. The present value of the seller note (depending on the buyer’s credit and the security package behind it) might be $1.4M to $1.7M, meaning the real value of the offer is $7.4M to $7.7M. When calculating business value to compare offers, always discount the seller note to present value at a risk-appropriate rate, not at the contractual interest rate.
When Each Formula Is the Right Lead Method
No single formula wins every time. Pick the lead method based on the business profile:
| Business Profile | Lead Method | Confirmation Methods |
|---|---|---|
| Owner-operator, under $1.5M SDE, stable | SDE x Multiple | Revenue multiple, asset value (floor) |
| Professional management, $1M-$10M EBITDA | EBITDA x Multiple | DCF, revenue multiple |
| High-growth SaaS, recurring revenue | Revenue (ARR) multiple | DCF, public comp multiples |
| Predictable, asset-light, 5-year forecast | DCF | EBITDA multiple |
| Asset-heavy with low cash flow | Adjusted asset value | EBITDA multiple (going concern floor) |
| Distressed or wind-down | Liquidation value | Adjusted asset value |
| Pre-revenue or new business | Cost-to-replicate or scorecard | Venture comps |
For owners earlier in the process trying to figure out which method even applies to their situation, our companion guide on how to determine the value of a business walks through the decision framework before you ever pick up a calculator. And for owners trying to set an ask price for a listing, see how to price a business for sale.
How CT Acquisitions Calculates Business Value for Sell-Side Mandates
When CT takes on a sell-side mandate, our valuation workflow runs every one of the five formulas above on every deal, plus a layered set of internal sanity checks built from our closed-deal dataset. Here is the playbook:
- Pull three years of P&L and balance sheet and rebuild on a normalized basis with documented add-backs.
- Run a quality-of-earnings-style review on add-backs before the package goes to buyers, every dollar of add-back needs an invoice, a bank entry, or a payroll record behind it.
- Calculate SDE and EBITDA both, even if only one is the lead method, because buyer types vary and the search funder will want SDE while the PE firm will want EBITDA.
- Pull industry-specific comp data from BVR DealStats, Pitchbook, and our internal closed-deal index for businesses in the same SIC code and size band that have closed in the past 18 months.
- Build a 5-year DCF with WACC built up from the Damodaran NYU Stern industry cost of capital plus size and illiquidity premia.
- Run a liquidation-value floor as a downside reference even on healthy businesses, because it sets the absolute walk-away.
- Triangulate the four methods, set ask at the high end, walk-away at the low end, and use the spread between them as the negotiating envelope.
- Pressure-test against current market by sending a teaser to three to five known active buyers in the category and measuring inbound interest before any formal launch.
For owners weighing whether to bring in outside valuation help before going to market, see what business valuation services actually cost and when to hire a business valuation expert versus run the math yourself. The right answer depends on transaction size, complexity, and how prepared the financials already are.
If you want CT to run the full five-formula triangulation on your business and tell you what we believe it would actually close at in the current market, the conversation starts with a free 20-minute call.
How to Calculate the Value of a Business: Frequently Asked Questions
What is the simplest way to calculate the value of a business?
The simplest defensible formula for an owner-operated small business is SDE x SDE Multiple. Calculate SDE (net income plus owner comp plus interest plus depreciation plus add-backs), then multiply by 2.0x to 4.0x depending on industry, growth, and customer concentration. That single calculation will get you within 15-20% of the real number for most small businesses under $1M in cash flow.
What multiple should I use to calculate the value of my business?
It depends on size and earnings metric. For SDE-based valuations on businesses under $1M SDE, expect 2.0x to 4.0x. For EBITDA-based valuations between $1M and $5M EBITDA, expect 4.5x to 7.5x. For lower-middle-market businesses with $5M-$25M EBITDA, expect 6.5x to 10x. Pull the current-quarter range from the BizBuySell Insight Report or IBBA Market Pulse and adjust for your industry.
How do you calculate EBITDA for a business valuation?
Start with net income. Add back interest expense, income taxes, depreciation, and amortization to get EBITDA. Then add back one-time non-recurring expenses, owner compensation above market rate (if any), and other defensible adjustments to get Adjusted EBITDA, the number a buyer will actually use to set the price.
What is the difference between SDE and EBITDA when calculating business value?
SDE adds back the owner’s full salary and benefits to reflect total economic return to a single owner-operator. EBITDA assumes a market-rate executive replaces the owner and does not add back their salary. SDE is used for owner-operated businesses under roughly $1M-$1.5M in cash flow; EBITDA takes over above that threshold.
How do you calculate a discounted cash flow business valuation?
Project unlevered free cash flow for five years, discount each year back to present value using your WACC, calculate a terminal value using the Gordon Growth formula (final-year FCF x (1 + g) divided by (WACC – g)), discount that back to present, and sum everything. For private US small businesses, WACC typically lands between 12% and 22%, and terminal growth between 2% and 3%.
Can I calculate the value of my business based on revenue alone?
You can, but only as a sanity check. Revenue multiples only work when margins match the industry norm, divergent margins make the revenue multiple wildly inaccurate. Use it as a confirmation alongside SDE or EBITDA methods, never as the lead method except in industries like SaaS or insurance agencies where revenue and price correlate tightly.
How do add-backs affect the value of a business?
Add-backs typically swing business value by 15-40%. A $1M EBITDA business with $300K of legitimate add-backs is really a $1.3M EBITDA business, and at a 6x multiple, that’s an $1.8M difference in price. Document every add-back with bank records, invoices, or payroll exports, and consider a Quality of Earnings study to harden the number before going to buyers.
How accurate are online business valuation calculators?
They are reasonable directional gut-checks but miss the variables that swing actual transactions, customer concentration, owner involvement, recurring revenue mix, working capital normalizations, and add-back quality. Use a SCORE or SBA calculator for a starting range, then refine with the five-formula triangulation above.
How long does it take to calculate the value of a business?
A rough triangulation takes 30-60 minutes if you have clean financials in front of you. A defensible, buyer-ready valuation with documented add-backs, a 5-year DCF, and current-quarter comp data takes 8-15 hours for a typical small business. A Quality of Earnings study from a CPA firm runs three to six weeks and $15K to $50K, but produces the strongest possible defense of the number.
What is IRS Revenue Ruling 59-60 and why does it matter for business valuation?
IRS Revenue Ruling 59-60 is the foundational guidance, published in 1959 and still in force, that lays out the eight factors fair-market-value business valuation must consider: nature of the business, economic outlook, book value and financial condition, earning capacity, dividend-paying capacity, goodwill, sales of stock, and market prices of comparable companies. Every formal business valuation in the US references it, and any tax-related valuation (estate, gift, ESOP, 409A) must follow it. The companion guidance in the IRS Business Valuation resources and the appraisal standards in USPAP are the rest of the regulatory stack.