How to Prepare Your Industrial Distribution Business for a Sale or Exit in 2026: The 36-Month Playbook
Preparing your industrial distribution business for exit in 2026 is a 36-month playbook. The first 12 months tighten the operating story around branch productivity, product-line margin, and customer mix, the middle 12 fix pre-LOI diligence gaps around inventory turnover and vendor concentration, and the final 12 turn one offer into a real competitive process. Consolidators like Sonepar, Rexel, WESCO, and Graybar underwrite each of these differently.
Exiting your industrial distribution business is the single largest financial event most owners will ever face. This guide is the no-fluff playbook for industrial distribution business owners who are 12-36 months from sale, covering how PE-backed buyers actually value your business in 2026, the 12 levers that move your multiple, pre-LOI diligence, deal-killers to fix before going to market, and the full 36-month exit prep timeline.
Updated April 2026 · CT Acquisitions

Most industrial distribution owners decide to sell, hire a broker, and find out 90 days later that their business is worth 30% to 50% less than they thought. The owners who get the top-quartile price start preparing 24 to 36 months before they ever talk to a buyer. This guide is the 36-month playbook for how to prepare your industrial distribution business for a sale or exit. It covers what private equity actually buys, the 12 levers that move multiples, the documents PE will ask for before they send an indication of interest, and the deal-killers that re-trade industrial distribution transactions during confirmatory diligence. Every number cites its source. Every recommendation comes from how the most active distribution buyers in 2026 actually behave, including the Imperial Dade and BradyPLUS $10B+ combination announced March 12, 2026 (Bain Capital press release, March 12, 2026).
If you are 6 to 36 months from a possible exit, this is the work that turns a 6x EBITDA outcome into a 10x EBITDA outcome. On a $3M EBITDA industrial distributor, that is the difference between an $18M sale and a $30M sale. Whether you want to prepare your industrial distribution business for a sale to private equity, prepare your industrial distribution business for an exit to a strategic acquirer like Applied Industrial Technologies or Ferguson, or simply maximize value over the next 1 to 3 years before going to market, the work below applies across MRO, bearings and power transmission, fluid power, safety, PVF, electrical distribution, janitorial and sanitary maintenance, and foodservice distribution.
Building toward an exit in 12 to 36 months?
CT Acquisitions runs sell-side advisory for industrial distribution owners $1M+ EBITDA. We also have distribution operations specialists in our partner network who run pre-sale optimization engagements when the timeline is longer. No fee to you on buy-side introductions; sell-side mandates are paid on success at closing.
What Private Equity Actually Buys in Industrial Distribution (2026)
US industrial distribution is a $200B+ TAM and one of the three most-active PE consolidation lanes since 2018, alongside HVAC and IT services, with 800+ disclosed PE-backed industrial distribution transactions tracked across 2018 to 2025 (PitchBook PE industrial distribution screen 2025; Capstone Partners Distribution and Logistics M&A Q4 2025). Modern Distribution Management tracked 137 disclosed industrial distribution deals in 2024 and 151 in 2025, with 62 more closed YTD through May 2026 (MDM M&A Tracker, 2024 and 2025). PE add-ons represented approximately 47% of total distribution and logistics M&A volume in 2025 (Capstone Partners Distribution and Logistics M&A Report, Q4 2025). Industrial Distribution Magazine’s Big 50 list shows that 22 of the top 50 distributors are now PE-owned or PE-backed, up from 14 in 2020 (Industrial Distribution Magazine Big 50, 2020 and 2025).
The headline transaction of the cycle is the Imperial Dade and BradyPLUS combination announced March 12, 2026, creating a $10B+ enterprise value entity with combined revenue exceeding $13B and four sponsor backers (Bain Capital, Advent International, Kelso & Company, Warburg Pincus) holding the combined platform (Bain Capital press release March 12, 2026; PE Hub coverage). That deal sets the high-water mark for JanSan and foodservice distribution multiples in 2026 and signals continued sponsor appetite for platform-scale industrial distribution assets.
The PE-attractive industrial distribution profile
- EBITDA threshold for a platform-quality deal: $1M to $3M is the entry band where sponsor-backed platforms run a competitive process. Below that, you are an add-on inside a roll-up. Above $5M, you are an attractive bolt-on for the larger platforms. Above $15M to $25M EBITDA, you are a platform candidate yourself.
- Recurring VMI revenue: Vendor Managed Inventory penetration is the industrial distribution equivalent of HVAC maintenance contracts. 30%+ of revenue under contracted multi-year VMI agreements is the line between commodity and premium. Transactional-only distributors trade at the lower end of their sub-sector band. VMI-heavy distributors carry a +1.0x to +2.0x multiple premium (Eaton Square VMI valuation premium guide 2025; Capstone Partners Industrial Distribution Q4 2025; MDM “Why VMI Drives Distribution Multiples” 2024).
- Geography: Sun Belt (Texas, Florida, Carolinas, Arizona, Colorado) plus critical-mass Midwest distribution hubs are where 2026 sponsor demand concentrates. Stranded geographies discount.
- Customer concentration: No single customer above 10% of revenue. Top 5 customers below 30%. Concentration above 20% triggers buyer pushback; above 25% triggers 15% to 30% valuation discount or buyer withdrawal (Beancount.io, May 2026; Strategex; Eagle Rock CFO; Morgan & Westfield).
- Supplier concentration: The deal-killer that matters more than customer concentration for distribution. No single supplier above 25% of COGS. Distribution agreements with assignment language or no change-of-control termination right (see Lever 5 below).
- Owner role: Owner is in management, not running counter sales, signing every check, or owning the top 10 customer relationships. CEO or GM in place 12+ months pre-sale.
Active industrial distribution PE platforms in 2026
The list below covers the most active sponsor-backed industrial distribution platforms plus the strategic acquirers in the 2024-2026 cycle. This is who will see your teaser. Add-on counts are point-in-time; sources include Bain Capital press releases (March 12, 2026), CD&R newsroom, Wynnchurch portfolio page, Audax Group portfolio page, Littlejohn & Co newsroom (Kaman Distribution March 2024), Wind Point Partners portfolio page, Cortec Group portfolio, PE Hub coverage, PrivSource Industrial Distribution Acquisitions database (May 2026), MergerLinks, PitchBook, MDM M&A Tracker, and Industrial Distribution Magazine Big 50 2025.
| Platform | Sponsor | Profile |
|---|---|---|
| Imperial Dade | Bain Capital, Advent International, Kelso & Company, Warburg Pincus (post March 2026 merger) | JanSan, foodservice packaging, industrial packaging; 100+ acquisitions historical, 12+ in 2024-2025; merger with BradyPLUS March 12, 2026 created the largest North American JanSan and foodservice distributor; add-on EBITDA $3M to $30M+ |
| BradyPLUS (legacy Brady Industries + Envoy Solutions) | Pre-merger: Warburg Pincus + Kelso; now combined with Imperial Dade | Janitorial, foodservice disposables, industrial packaging; 24 add-ons under Envoy/BradyPLUS banner since 2020; $3M to $20M EBITDA |
| Motion & Control Enterprises (MCE) | Bain Capital (acquired from CD&R 2024) | Fluid power, motion control, automation; 30+ companies in platform; 6 disclosed add-ons 2024-2025; $3M to $15M EBITDA |
| SunSource | Clayton, Dubilier & Rice (CD&R) with Audax minority | Fluid power, hydraulics, pneumatics, MRO; 60+ acquisitions historical, 8+ disclosed 2024-2025; $3M to $20M EBITDA |
| Kaman Distribution Group (KDG) | Littlejohn & Co (acquired from Kaman Aerospace March 2024 for $1.8B) | Power transmission, fluid power, automation; continuous post-buyout add-on cadence; $3M to $25M EBITDA |
| Industrial Service Solutions (ISS) | Wynnchurch Capital | Industrial repair plus distribution (motors, pumps, gears); 25+ companies cumulative; 5+ disclosed 2024-2025; $3M to $20M EBITDA |
| SBP Holdings (Singer Equities) | Audax Group | Hose, gaskets, sealing products distribution; 30+ acquisitions cumulative; 6+ disclosed 2024-2025; $3M to $15M EBITDA |
| DSG Inc (Lawson Products + TestEquity + Hisco + Gexpro Services) | Public (NASDAQ: DSGR) | MRO, fasteners, electrical, test and measurement; 8+ disclosed acquisitions 2024-2025 including Source Atlantic 2025; $5M to $30M EBITDA |
| CHB Industries | Cortec Group | Industrial distribution and specialty MRO; 4 disclosed add-ons 2024-2025; $2M to $10M EBITDA |
| Bishop Lifting Products | Wind Point Partners (acquired from Whitewater Holding 2024) | Lifting, rigging, fall protection distribution; 7 add-ons since Wind Point ownership; $2M to $10M EBITDA |
| Vallen Distribution | Nautic Partners (acquired from Sonepar March 2025) | MRO, integrated supply for industrial customers; first add-ons under Nautic disclosed Q4 2025; $3M to $20M EBITDA |
| Singer Industrial | Wind Point Partners | Hose, conveyor, sealing distribution; 25+ historical, 5+ disclosed 2024-2025; $2M to $15M EBITDA |
| Tradesmen Group | Audax Group | Industrial fasteners, safety, MRO; multiple add-ons in 2024-2026 cadence; $2M to $10M EBITDA |
| Veritiv (combined with Orora Packaging Solutions Aug 2024) | CD&R (took private November 2023 at $2.6B) | Packaging, facility solutions, print; continuous post-take-private add-on activity; $5M to $50M EBITDA |
| Global Industrial Co | Public (NYSE: GIC) | MRO, industrial supplies, packaging; 3 add-ons 2024-2025 including Indoff (April 2024, ~$72M); $5M to $50M EBITDA |
| Industrial Container Services | Greenbriar Equity Group | Industrial container distribution and reconditioning; multiple add-ons; $3M to $20M EBITDA |
Add to that list the strategic acquirers. Applied Industrial Technologies (NYSE: AIT) closed 5+ acquisitions in fiscal 2024-2025 including Hydradyne (August 2024, $272M) and Stanley Proto Industrial Tools (April 2025), with implied 8x to 11x EBITDA multiples on platform-quality targets (Applied Industrial Form 10-K FY2025). Ferguson Enterprises (NYSE: FERG) closed 8 bolt-on PVF and plumbing distribution targets in FY2025 contributing approximately $130M in revenue (Ferguson Form 10-K FY2025). Core & Main (NYSE: CNM) closed 7 water and wastewater distribution add-ons in FY2025 (Core & Main Form 10-K FY2025). MSC Industrial Direct (NASDAQ: MSM), Fastenal (NASDAQ: FAST), WESCO International (NYSE: WCC), Watsco (NYSE: WSO), Sonepar (private French electrical distribution leader), Rexel (Euronext: RXL), Genuine Parts Company (NYSE: GPC, parent of EIS Inc), Wurth Group (private German), HD Supply (subsidiary of Home Depot NYSE: HD), and ABC Supply remain active strategic buyers across their respective sub-sectors. Public industrial distributors tend to pay 8x to 12x EBITDA for clean tuck-in distribution targets, with platform additions occasionally going higher.
Industrial Distribution Valuation Multiples in 2026 (What You Are Actually Worth)
The multiple a buyer pays comes down to your sub-sector, your size, your VMI penetration, your supplier diversification, and your customer concentration. Industrial distribution multiples vary heavily by sub-sector. The premium tier sits in janitorial and sanitary maintenance and foodservice distribution (driven by Imperial Dade tier-1 buyer demand) and the discount tier sits in low-margin commodity PVF and electrical distribution with single-supplier exposure. Here is the 2026 range, cross-referenced from Capstone Partners reports, IBBA Market Pulse Q4 2025, Eaton Square, Generational Equity, Peak Business Valuation, BizBuySell Q4 2025, and the public-comp set (Applied Industrial, MSC, Fastenal, Ferguson, Core & Main, Watsco, WESCO).
SDE multiples (smaller, owner-operated)
| SDE band | SDE multiple | Profile fit |
|---|---|---|
| Under $500K SDE | 2.0x to 2.75x | Owner-operator transactional distributor; IBBA Market Pulse Q4 2025; BizBuySell Q4 2025 |
| $500K to $1M SDE | 2.5x to 3.25x | IBBA Q4 2025 lower middle market baseline; Peak Business Valuation 2025 |
| $1M to $2M SDE | 3.0x to 4.0x | IBBA Q4 2025; Generational Equity industrial distribution guide 2025 |
| Distribution with VMI program and recurring customer base | 3.5x to 5.0x SDE | Generational Equity 2025; Eaton Square distribution valuation guide 2025 |
EBITDA multiples by sub-sector (PE-attractive size)
Sub-sector matters more than size up to about $5M EBITDA. The sub-sector premium is driven by buyer demand (how many PE platforms are actively acquiring) and by structural margin attractiveness (recurring revenue, switching costs, VMI penetration).
| Sub-sector | $1M to $3M EBITDA | $3M to $10M EBITDA | $10M+ EBITDA / Platform |
|---|---|---|---|
| Janitorial and sanitary (JanSan) | 6x to 8x | 8x to 11x | 10x to 14x (Imperial Dade tier) |
| Foodservice distribution | 6x to 9x | 8x to 12x | 11x to 14x |
| Electrical distribution | 7x to 9x | 8x to 11x | 9x to 12x |
| PVF (pipe, valve, fittings) and industrial MRO | 6x to 8x | 7x to 10x | 9x to 12x |
| Fluid power (hydraulics and pneumatics) | 7x to 9x | 8x to 11x | 10x to 13x |
| Bearings and power transmission | 7x to 9x | 8x to 11x | 10x to 12x |
| Safety distribution | 6x to 8x | 7x to 10x | 9x to 12x |
| Specialty (cutting tools, abrasives, welding) | 7x to 10x | 8x to 11x | 10x to 13x |
Sources: Capstone Partners Distribution and Logistics M&A Q4 2025; Capstone Partners Electrical Distribution M&A 2025; Capstone Partners Foodservice Distribution 2025; Eaton Square JanSan distribution valuation 2025; Sonepar and Rexel public comp; Ferguson and Core & Main comp set; SunSource, MCE, and Audax Singer Equities comp; Applied Industrial Form 10-K comp; Kaman Distribution acquisition comp; MSC Industrial comp; DSG and Hisco comp. Cross-reference IBBA Q4 2025 lower middle market all-industry numbers as a floor: $2M to $5M EBITDA median is 4.1x EBITDA, $5M to $50M EBITDA median is 5.5x EBITDA. Industrial distribution multiples sit 1.5x to 3.0x above the all-industry median in 2025-2026, reflecting unusual sector demand (IBBA Q4 2025 Market Pulse; Capstone Distribution Q4 2025).
Recent disclosed industrial distribution transactions (2024-2026)
| Acquirer | Target | Date | Value | Implied multiple |
|---|---|---|---|---|
| Imperial Dade (Bain/Advent/Kelso/Warburg) + BradyPLUS merger | Combined entity | March 12, 2026 | $10B+ EV / $13B revenue | Estimate 9x to 11x EBITDA |
| Littlejohn & Co | Kaman Distribution Group | March 2024 | $1.8B | ~11x to 12x on $150M+ EBITDA |
| Nautic Partners | Vallen Distribution (from Sonepar) | March 2025 | Undisclosed; estimate $800M to $1.2B | Estimate 8x to 10x |
| Applied Industrial Technologies | Hydradyne | August 2024 | $272M | ~10x EBITDA on $27M EBITDA |
| CD&R | Veritiv take-private (anchor comp) | November 2023 | $2.6B | 9x to 10x EBITDA |
| Global Industrial Co | Indoff Incorporated | April 2024 | $72M | ~8x to 9x EBITDA |
| Ferguson Enterprises | 8 bolt-on PVF and plumbing targets | FY2025 | $130M revenue contributed | Estimate 8x to 11x |
| Core & Main | 7 water and wastewater distribution add-ons | FY2025 | Aggregate ~$200M revenue | Estimate 9x to 12x |
Sources: Bain Capital press release March 12, 2026; Kaman Aerospace 8-K March 2024; Littlejohn press release; Sonepar press release March 2025; PE Hub; Applied Industrial Form 10-K FY2025; Veritiv DEF14A 2023; CD&R press release November 2023; Global Industrial Form 10-K FY2024; Ferguson Form 10-K FY2025; Core & Main Form 10-K FY2025. Capstone Partners notes industrial distribution multiples expanded approximately 0.5x to 1.5x in 2024-2026 vs. 2020-2022 baseline, driven by PE platform capital and strategic-buyer rationalization (Capstone Partners Distribution and Logistics M&A Q4 2025). BizBuySell Q4 2025 Insight Report shows industrial distribution and wholesale categories saw 14% year-over-year increase in closed lower-middle-market transactions, with median sale price up 9% year over year (BizBuySell Q4 2025 Insight Report, January 2026).
The 12 Value Levers That Move Your Multiple (Ranked by Impact)
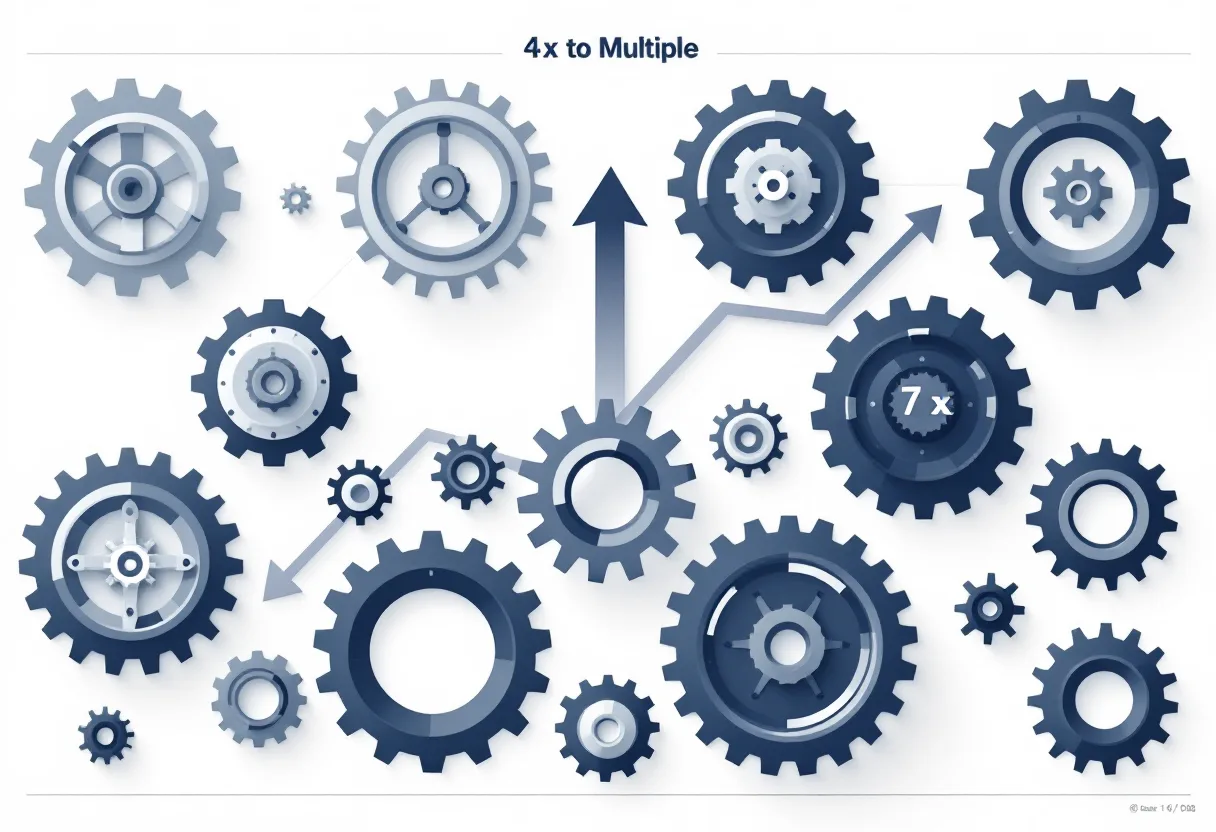
These are the levers that move industrial distribution multiples in the 24 months before a sale. Each one has a current state, a target state, and an estimated financial impact. The ordering is by dollar impact per unit of effort, based on cross-source synthesis from Capstone Partners, Eaton Square, Generational Equity, Modern Distribution Management, and Industrial Distribution Magazine.
Lever 1: Build VMI program penetration
Current: Under 10% of revenue from VMI contracts; most customers are transactional. Target: 30%+ of revenue from contracted VMI agreements with multi-year terms. Impact: VMI-heavy distributors trade at a +1.0x to +2.0x multiple premium because of contracted recurring revenue (Eaton Square VMI valuation premium guide 2025; Capstone Partners Industrial Distribution Q4 2025; MDM “Why VMI Drives Distribution Multiples” 2024). On a $3M EBITDA business this is $3M to $6M of additional sale price. VMI is the industrial distribution equivalent of the HVAC maintenance contract: recurring, switching-cost protected, and directly underwritable into a forward case. How: Identify 20 to 30 top customer candidates for VMI. Build a VMI sales motion (typically requires a dedicated inside-sales or VMI specialist). Invest in barcode scanning and replenishment software. Document VMI revenue separately from transactional revenue in the ERP so it shows up cleanly in the data room.
Lever 2: De-concentrate single supplier exposure
Current: Single supplier (Eaton, ABB, Parker Hannifin, Goodyear, 3M, S.C. Johnson, Ecolab, Caterpillar, or Cummins) above 25% of COGS; distribution agreement has change-of-control termination right. Target: No supplier above 15% of COGS; top 5 suppliers below 60%; distribution agreements with change-of-control protection or assignment rights negotiated 18 to 24 months pre-sale. Impact: Single-supplier exposure with hostile change-of-control language is the single biggest distribution-sector deal-killer. The buyer either restructures the deal (huge holdback), walks, or makes the deal contingent on supplier consent. Estimate 1.0x to 2.0x multiple haircut or full deal-breaker (Eaton Square 2025; Generational Equity Distribution Guide 2025; MDM “Distribution Agreement Diligence” 2024). On a $3M EBITDA, a 2.0x reset removal equals $6M of price preservation. How: Add second and third suppliers in top-3 product categories. Renegotiate distribution agreements 18 to 24 months pre-sale to soften change-of-control language. Have legal review every top-10 supplier agreement for change-of-control language before going to market. Document the supplier diversification roadmap for the CIM.
Lever 3: Move the owner out of the chair
Current: Owner runs sales, owns the top 10 customer relationships, signs every check, is the qualifying license-holder if any state license applies. Target: CEO or GM in place 12+ months before going to market. Owner doing under 30 hours/week of operational work. Sales relationships transitioned to an outside sales team. Impact: Owner-dependence is the most-cited multiple haircut across distribution valuation literature (Generational Equity 2025; Eaton Square 2025; Capstone Q4 2025). On a $2M to $5M EBITDA business, removing key-person risk moves the multiple from the 7x to 8x band into the 9x to 11x band, worth $2M to $15M of price. How: CEO or GM hire 18 to 24 months pre-sale (typical comp $250K to $400K plus bonus). Document all SOPs. Transition top-customer relationships to the outside sales team. Take a 2-week unplugged vacation as the stress test.
Lever 4: Lift private-label and own-brand mix
Current: Under 5% private label; reliance on branded product margin. Target: 15% to 25% private label across high-velocity SKU categories. Impact: Each 10 points of private-label mix adds 200 to 400 bps of gross margin (Industrial Distribution Magazine “Private Label Premium” 2024). On a $30M revenue distributor, a 15-point shift adds $900K to $1.8M of gross profit, most of which drops to EBITDA. At a 9x multiple that is $7M to $15M of additional sale price. Estimate 0.5x to 1.0x multiple uplift from private-label mix maturity. How: Identify 5 to 10 SKU categories where private label is viable (commodity items where brand does not drive the sale). Source via overseas private-label manufacturer or domestic contract manufacturer. Brand under house mark. Disclose private-label vs. branded gross margin separately in the data room.
Lever 5: Deploy modern distribution ERP (Eclipse, Prophet 21, or SX.e)
Current: QuickBooks plus spreadsheets, no real product-level P&L, no inventory turns visibility. Target: Epicor Eclipse, Epicor Prophet 21, Infor SX.e, SAP, or NetSuite fully deployed with monthly close in 15 days and clean KPI reporting. Impact: Estimated +0.5x to 1.0x multiple uplift, driven primarily by the speed and credibility of data-room responses during diligence and by the fact that PE platforms standardize on Eclipse or Prophet 21 (cross-source Capstone Q4 2025; MDM “Distribution ERP Landscape” 2024). On a $3M EBITDA business at 9x baseline, +0.5x equals $1.5M of price. How: Budget $200K to $500K implementation cost plus per-user license for a $1M to $5M EBITDA distributor. Allow 9 to 12 months for go-live. Run parallel for 90 days. The earlier you start, the cleaner the trailing-twelve-months data in the CIM.
Lever 6: De-concentrate the customer base
Current: Top customer above 15% of revenue (or top 5 above 40%). Target: Top customer below 10%; top 5 below 30%. Impact: Concentration above 20% triggers buyer pushback. Above 25% triggers a 15% to 30% valuation discount or buyer withdrawal (Beancount.io May 2026; Eagle Rock CFO; Strategex; Morgan & Westfield). Industrial distribution is particularly exposed because OEM and industrial-plant accounts can balloon to 30% to 50% of revenue quickly. How: Diversify into new customer verticals. Add new VMI accounts (which both diversify and add recurring revenue). Geographic expansion. Optional: deliberately reduce share with the largest customer by removing volume discount so the relative weighting shrinks naturally.
Lever 7: Drive inventory turns from 4x to 6x or higher
Current: Inventory turns 3x to 4x; slow-moving and obsolete (SLOB) above 15% of inventory value. Target: Inventory turns 6x+; SLOB under 5%; documented E&O reserve methodology. Impact: Working capital reduction frees cash and supports valuation. Estimate +0.25x to 0.5x multiple. More importantly, the buyer’s working capital peg is set off lower inventory, meaning more cash to seller at close. On a $30M revenue distributor with 25% to 40% of revenue trapped in working capital (MDM Distribution KPI Benchmark 2025), pulling inventory turns from 4x to 6x can free $2M to $4M of working capital. How: Cycle counting; supplier-managed inventory for fast-movers; scrap or sell off 360+ day stock 12 months before close; deploy inventory optimization software (Slimstock, Netstock, Smart Software).
Lever 8: Build e-commerce and digital ordering capability
Current: Under 10% of orders online; reliance on phone, email, and counter sales. Target: 30%+ online ordering; integrated PunchOut catalog (cXML, OCI) for top OEM and industrial accounts. Impact: Estimate +0.5x to 1.0x multiple (MDM “E-commerce in Distribution” 2024; Industrial Distribution Magazine 2024). Buyers consistently pay a premium for digital-enabled distribution platforms because e-commerce is the natural integration path with platform stacks. How: Deploy a commerce platform (Episerver, BigCommerce B2B, Unilog, Insite Software). Integrate to the ERP. Build PunchOut for the top 5 industrial accounts. Track online order penetration as a monthly KPI for at least 12 months pre-sale.
Lever 9: EBITDA add-back hygiene
Current: Owner mixes personal expenses through the business with no documentation; related-party rent at well-above FMV; no add-back schedule. Target: Every potential add-back documented as it happens with underlying invoice; related-party rent re-struck to FMV with appraisal on file. Impact: Every defensible dollar of adjusted EBITDA is multiplied by the buyer’s multiple. On a 9x multiple, $200K of clean add-backs equals $1.8M of sale price (Morgan & Westfield QoE guide). How: Adopt a monthly add-back log starting today. Document the business purpose of every charge. Common industrial distribution add-backs that hold up: owner compensation above market, one-time ERP implementation cost, owner family-member payroll, owner vehicle and personal travel, owner health insurance and country-club, related-party rent at above-FMV, one-time warehouse expansion or relocation costs, and COVID-era ERC.
Lever 10: Working capital normalization
Current: Volatile A/R cycle; inventory builds at year-end (rebate-driven); deferred customer-rebate liability not isolated. Target: TTM-average working capital is stable; deferred rebate liability separately tracked; supplier rebate receivable separately tracked. Impact: The working capital peg is set off the trailing 6 to 12 months. Volatile working capital lets the buyer set a higher peg, subtracting from the purchase price. Estimate: poorly managed working capital can cost 3% to 7% of enterprise value at close on a distribution business, higher than HVAC because working capital is a bigger share of EV in distribution (cross-source BDO; Morgan & Westfield NWC for M&A guide). How: Tighten A/R collection cycle to a DSO under 50 days. Manage inventory turns. Isolate customer-rebate liability. Isolate supplier-rebate receivable. Adopt a monthly working capital dashboard.
Lever 11: Real estate decision (own or lease, and the sale-leaseback option)
Current: Owner-occupied warehouse held in the same entity as the operating business, or in an LLC at above-FMV rent. Target: Real estate in a separate LLC at FMV NNN lease to the operating company, with a clear path for the buyer to either assume the lease or buy the real estate. Impact: Separating real estate often lifts the implied EBITDA multiple on the operating business because the buyer is not forced to underwrite real estate exposure (Plante Moran sale-leaseback primer; Northmarq sale-leaseback guide). A sale-leaseback can release up to 100% of property market value vs. 70% to 80% LTV traditional financing. Estimate impact: holding real estate separately at FMV typically adds 0.5x to 1.0x on the operating company multiple. How: Get an FMV market rent study. Re-strike rent to FMV. Decide before going to market whether the real estate is part of the deal or held back.
Lever 12: Compliance scrub (DOT, EPA, DEA, ITAR/EAR, sales/use tax)
Current: Sales and use tax compliance uneven; DOT fleet records incomplete; resale certificates from wholesale customers not all on file; no ITAR or EAR audit if defense-adjacent. Target: Sales and use tax compliance verified by outside counsel in every operating state; DOT fleet inspection records current; resale certificates on file for every wholesale customer with expiration dates tracked; ITAR and EAR audit completed if defense customers exceed 5% of revenue. Impact: Each of these can kill or re-trade the deal at confirmatory diligence. See the deal-killer section below for specifics. How: Cover this in months 24 to 12 of the run-up, before the QoE.
Want to grow your business to maximize value before exiting?
We connect industrial distribution owners with operations experts in our partner network who run 12 to 24 month pre-sale optimization engagements covering VMI conversion, private-label rollout, supplier diversification, and ERP migration. The engagement pays for itself in incremental sale price.
What PE Asks Before They Send an LOI (The Pre-LOI Diligence Stack)
Before a PE firm commits to a letter of intent, they ask for a focused diligence package. The list below is the standard pre-LOI ask for an industrial distribution business in CT Acquisitions’ pipeline. The “why” and “how to prepare” expand each item to what is typical across the sector. The pre-LOI ask for industrial distribution emphasizes supplier concentration, inventory health, and customer concentration as the three most important diagnostics.
1. Income statements for 2024, 2025, and the latest trailing twelve months
Why PE asks: They are building the LTM EBITDA they will multiply. They want trend (growth rate, gross margin trajectory), seasonality (industrial distribution is less seasonal than consumer but still has Q4 inventory build-up cycles), and any one-time movers (large project shipments, customer wins, supplier rebates booked at year-end).
How to prepare: Accrual-basis P&L by month. Revenue by product category and by customer type (commercial industrial, government, OEM, MRO end-user). Reconcile to tax returns. Isolate supplier-rebate income as a separate line so the buyer can model it cleanly.
2. Balance sheet at the latest month
Why PE asks: Two reasons. First, working capital peg sizing. Industrial distribution has unusually large working capital (inventory and A/R combined typically 25% to 40% of revenue per MDM Distribution KPI Benchmark 2025), so the peg materially affects net cash to seller. Second, net debt identification (cash minus interest-bearing debt minus debt-like items including unfunded customer rebate liability, supplier deposits, accrued bonuses, capital lease balances on warehouse equipment).
How to prepare: Tie the balance sheet to the trial balance. Isolate slow-moving and obsolete inventory (E&O reserve required) because buyers will write down anything older than 12 months. Disclose customer deposits separately. Identify supplier rebate accruals (rebates owed back to customers or earned from suppliers but not yet collected).
3. Adjusted EBITDA bridge with add-back documentation
Why PE asks: They want a sneak peek at your adjusted EBITDA story before sinking diligence cost into the file. If your add-backs are aggressive or undocumented, they discount the rest of your numbers and offer at the lower end of the range.
How to prepare: Bridge from book EBITDA to adjusted EBITDA, line by line. Document every add-back with the underlying invoice or payroll record. Common industrial distribution add-backs that hold up: owner compensation above market (if owner takes $500K but a CEO would cost $300K, $200K adds back), one-time ERP implementation cost, owner family-member payroll, owner vehicle and personal travel, owner health insurance and country-club, related-party rent at above-FMV, one-time warehouse expansion or relocation costs, COVID-era ERC. Sources: Morgan & Westfield QoE Ultimate Guide; Eton QoE pricing 2025; Riveron M&A advisory.
4. Anonymized employee roster (titles, start dates, pay structure, classification)
Why PE asks: Two risks. First, technical-sales depth: industrial distribution runs on technical outside-sales reps who own customer relationships. PE wants to see rep tenure, customer assignment, comp structure, and non-compete enforceability. If 2 senior reps own 40% of accounts and have no non-competes, that is concentrated key-person risk. Second, warehouse and delivery staff classification: W-2 vs. 1099 on delivery drivers and warehouse contractors is a sales and use tax and DOL exposure (see deal-killer section).
How to prepare: Roster with role, hire date, full-time vs. part-time, W-2 vs. 1099, comp structure (base plus commission plus bonus), and active non-compete or non-solicit. Calculate and disclose 12-month and 24-month sales-rep retention. For drivers, disclose CDL status and DOT compliance.
5. Revenue breakdown by product line, customer type, and channel
Why PE asks: This is the single most diagnostic exhibit for industrial distribution. It tells them whether your gross margin is concentrated in branded vs. private-label products, whether you have any VMI revenue (contracted, recurring), whether your customer mix is commercial industrial / OEM / government / construction (each carries different multiples and payment terms), and whether your average ticket and number of unique SKUs sold are growing.
How to prepare: Pull from the ERP (Eclipse, Epicor Prophet 21, SAP, NetSuite, Infor SX.e). Revenue by product category, by customer type, by sales channel (online vs. counter vs. outside sales vs. inside sales). VMI revenue isolated. Private-label vs. branded mix disclosed.
6. Customer concentration (Top 10 by revenue and gross margin)
Why PE asks: Concentration above 15% on a single customer triggers buyer pushback; above 25% is a deal-killer or 15% to 30% valuation haircut (Beancount.io 2026; Strategex; Eagle Rock CFO). Industrial distribution is particularly exposed because single OEM or industrial-plant customer wins can balloon to 40% or more of revenue quickly.
How to prepare: Top 10 customers by revenue with percent of total, contract terms (master purchasing agreement length, assignment clause, change-of-control trigger), payment terms (Net 30 vs. Net 60 vs. Net 90), and gross margin by customer.
7. Supplier concentration (Top 10 by COGS, CRITICAL for distribution)
Why PE asks: Single-supplier concentration is the number-one distribution-specific deal-killer. If 30% of your COGS or 40% of revenue runs through one supplier (Eaton, ABB, Caterpillar, Parker Hannifin, Goodyear, 3M, S.C. Johnson, Ecolab), the buyer asks: can the supplier terminate distribution rights post-close, is there a change-of-control trigger in the distribution agreement, and what are the territory exclusivity terms. Many distribution agreements have explicit change-of-control termination rights that destroy enterprise value on close.
How to prepare: Top 10 suppliers by COGS with percent of total, distribution agreement summary (territory, exclusivity, term, renewal, termination rights, change-of-control clause, rebate structure). Have legal review every top-10 supplier agreement for change-of-control language before going to market.
8. Recurring revenue and VMI snapshot
Why PE asks: VMI programs are the recurring-revenue equivalent for industrial distribution. PE wants count of active VMI accounts, contracted ARR, contract duration, renewal cadence, and gross margin. VMI revenue trades at 2x to 4x of standalone transactional revenue in implied valuation terms.
How to prepare: List of VMI accounts with start date, contract end date, monthly or quarterly revenue, gross margin, and renewal terms. Isolate ARR snapshot.
9. Inventory detail (SKU count, turns, E&O reserve, aging)
Why PE asks: Industrial distribution lives on inventory. The buyer wants total SKU count, inventory turns (target 6x+; below 4x is a working capital trap), slow-moving and obsolete (SLOB) reserve, consigned vs. owned vs. on-hand, and inventory aging by SKU. The E&O reserve becomes a working capital adjustment at close.
How to prepare: ERP-pulled inventory aging report (current, 90 days, 180 days, 360 days, 360+ days). E&O reserve methodology documented. Scrap or sell off any 360+ day stock 12 months before going to market.
10. Five-year business plan
Why PE asks: PE underwrites a forward case. For industrial distribution they want to see how you intend to grow (geographic expansion, new product lines, e-commerce penetration, VMI account additions, private-label introduction).
How to prepare: Operating model with revenue by product, customer, and channel, gross margin assumptions, overhead growth, and EBITDA. Capacity build (warehouses, sales reps, delivery fleet). Pipeline of named VMI prospects and target supplier additions.
11. Asset and fleet list (warehouse equipment, vehicles, racking)
Why PE asks: CapEx forecast. Warehouse equipment (forklifts, conveyors, racking) has a 10 to 15 year useful life; delivery fleet has a 5 to 8 year useful life. Capital lease vs. owned matters for net debt. DOT compliance on fleet matters for legal diligence.
How to prepare: Asset register with each major asset, description, in-service date, useful life, depreciation status, lease vs. owned, monthly payment, and replacement cost. Fleet list with vehicle ID, DOT inspection status, CDL driver assignment.
Confirmatory Diligence (After You Sign the LOI)
Once an LOI is signed and exclusivity starts (typically 45 to 90 days for industrial distribution per Colonnade Advisors podcast 020 and Capstone Partners sell-side process guide), the buyer runs parallel workstreams. This is the depth of inspection your business will undergo. If anything was hiding, it surfaces here.
- Quality of Earnings (QoE). Outside accounting firm runs revenue cut-off testing, supplier rebate analysis, inventory valuation testing, expense normalization, add-back validation, and working capital trends. Buy-side QoE for a $1M to $10M EBITDA industrial distributor costs $75K to $250K (Riveron; Eton 2025; KLR 2025). Output: an adjusted EBITDA number the buyer locks into the model.
- Customer and supplier concentration analysis. Top customer interviews, top supplier interviews, distribution agreement review, change-of-control trigger analysis on every top-10 supplier agreement.
- IT systems audit. ERP (Eclipse, Prophet 21, SAP, NetSuite, Infor SX.e), CRM, e-commerce platform. Data quality, integration capability with the platform’s stack, license counts, master data hygiene.
- Legal. Entity good standing, distribution agreements (full review for change-of-control and assignment language), real estate leases, IP, litigation history, warranty exposure, product-liability tail.
- HR and payroll. W-2 vs. 1099 classification (especially delivery drivers and warehouse contractors), I-9 compliance, wage-and-hour exposure (overtime classification for warehouse staff), benefits, PTO accrual, sales-rep commission disputes, non-compete enforceability, EEOC and DOL claims.
- Environmental. Phase I ESA on any owned warehouse property. Hazmat handling records (DEA-controlled solvents, EPA-regulated chemicals, DOT-placarded shipments). DOT compliance on fleet (driver hours-of-service logs, vehicle inspections, FMCSA safety scores).
- Tax. Federal income, payroll, sales and use, property. Sales tax compliance in every operating state (resale certificates on file for every wholesale customer; this is a recurring distribution-sector exposure). Export compliance (ITAR if defense-adjacent customers; EAR for dual-use products).
Why You Should Pay for Your Own Quality of Earnings Before Going to Market
A sell-side QoE is your own outside accountant’s QoE, paid for by you, before you go to market. For industrial distribution specifically it does five things. It pre-empts the buyer’s QoE by getting to the adjusted EBITDA number first, with documentation. It surfaces inventory valuation issues you can fix before the buyer sees them (E&O reserve adequacy, slow-moving SKU writedowns). It validates supplier rebate accruals and customer rebate liabilities, the two biggest distribution-specific QoE adjustments. It tightens the EBITDA number you take to market, which directly drives the headline price. And it documents the working capital methodology you intend to negotiate at close (critical because working capital is unusually large in distribution).
Cost
- $35K to $50K for QoE if revenue is below $10M with simple operations (Eton Venture Services 2025; Morgan & Westfield QoE guide).
- $50K to $100K typical range for a healthy industrial distributor with multiple product lines, multiple supplier rebates, and VMI revenue streams (Kahn Litwin Renza 2025; Eton 2025).
- $100K to $200K for businesses with multi-entity structures, international sourcing, or complex inventory (Eton 2025; Riveron 2025).
Industrial distribution QoEs are typically 25% to 50% more expensive than HVAC QoEs because of the inventory valuation work, supplier rebate analysis, and multi-state sales tax exposure review (cross-source Eton 2025; KLR 2025).
ROI
Example cited across QoE provider content: a $30M revenue, $4M EBITDA industrial distributor. Moving the multiple from 8x to 9x equals $4M of additional sale price. A $75K QoE investment that supports the 1x lift is a 53x return (Eton “Quality of Earnings Report Cost” 2025). Industrial-distribution-specific example: a $20M revenue PVF distributor showed $2M EBITDA on tax returns. The QoE came back at $1.4M adjusted EBITDA after removing unsupported supplier rebate accruals and writing down obsolete inventory. The owner got to fix that pre-market (cycled the bad inventory, reset the rebate methodology) and went to market at a defensible $1.8M EBITDA, rather than getting re-traded during confirmatory (cross-reference EBIT Community QoE guide 2025; Morgan & Westfield QoE guide).
Deal-Killers That Re-Trade Industrial Distribution Transactions (Avoid These)
These are the recurring kill-shots cited across industrial distribution M&A advisory content and confirmatory diligence checklists. Most of them are fixable in 12 to 24 months. None of them are fixable in 30 days.
1. Supplier concentration with change-of-control termination right
The single biggest distribution-sector deal-killer. If 30%+ of COGS or 40%+ of revenue runs through one supplier (Eaton, ABB, Parker Hannifin, Goodyear, 3M, S.C. Johnson, Ecolab, Caterpillar, Cummins) and the distribution agreement has a change-of-control termination clause, the buyer either restructures the deal with a huge holdback, walks, or makes the deal contingent on supplier consent. Cross-source: Eaton Square 2025; Generational Equity 2025; MDM “Distribution Agreement Diligence” 2024.
2. Customer concentration above 20%
Top customer above 15% gets PE nervous; above 20% they price the discount; above 25% they walk or restructure (Beancount.io 2026; Strategex; Eagle Rock CFO; Morgan & Westfield). SBA lenders get uncomfortable at 20% (Wall Street Prep 2025). Industrial distribution is particularly exposed because OEM and industrial-plant accounts can balloon to 30% to 50% of revenue.
3. Dirty inventory (E&O understated, no SLOB reserve)
If physical inventory contains 15%+ slow-moving or obsolete stock and there is no documented E&O reserve, the buyer’s QoE writes it down and takes the writedown out of purchase price or working capital peg. Common in distributors with long product cycles (bearings, fluid power components) or fashion-adjacent products (safety wear) per MDM “Distribution Inventory Management” 2024 and Eaton Square 2025.
4. Inventory turn ratio below 4x (working capital trap)
Industrial distribution lives on inventory turns. Turns below 4x mean cash is trapped on shelves and the working capital peg the buyer sets at close is high, which subtracts dollar-for-dollar from net cash to seller. Distributors with 3x turns sit on 30% to 50% more inventory than they need to support the same revenue (MDM Distribution KPI Benchmark 2025). The buyer prices that as a permanent capital drag.
5. ERP and CRM data quality issues
Sloppy customer master, missing addresses, jobs not closed, no recurring-revenue flags, inconsistent product codes. The buyer’s IT diligence surfaces it. The integration risk gets priced into the deal as escrow holdback, or the PE platform requires migration to platform-standard ERP (typically Eclipse or Prophet 21 in industrial distribution) at seller cost (cross-source MDM “ERP Landscape” 2024).
6. W-2 vs. 1099 misclassification on warehouse and delivery staff
Distributors that run warehouse contractors or delivery drivers as 1099 to dodge payroll tax are sitting on a liability. IRS settlements range $10K to $100K+ per misclassified worker once back taxes, penalties, interest, and legal cost aggregate (Tax1099 guide; ADP SPARK 2023; IRIS 2025). FedEx Ground delivery driver settlements set precedent here (FedEx Ground $228M settlement 2015; subsequent state-level enforcement).
7. Sales and use tax exposure (missing resale certificates)
Wholesale distribution requires resale certificates from every wholesale customer to support the tax-exempt status of sales. If certificates are missing, expired, or incorrectly executed, the state auditor assesses sales tax on the full transaction (the distributor becomes the de facto retailer for tax purposes). Multi-state exposure is the common case for distributors operating across 5+ states. Cross-source: Avalara sales tax for distributors 2024; Sales Tax Helper distribution sector 2025.
8. DOT compliance failures on fleet
If the distributor owns delivery fleet, DOT requires driver hours-of-service logs, vehicle inspection records, a drug and alcohol testing program, and FMCSA registration. CSA scores above the intervention threshold trigger audits and can suspend operating authority. Cross-source: FMCSA enforcement records 2024-2025; ATA fleet compliance benchmarks.
9. EPA, DEA, and hazmat exposure
Distributors handling chemicals, solvents, refrigerants, batteries, or DEA-controlled substances (industrial cleaners, certain solvents) face EPA RCRA hazmat rules, OSHA HazCom, and DEA registration. Missing manifests, expired waste-generator IDs, or unregistered DEA-controlled product handling triggers fines from $10K to $100K+ per violation. Cross-source: EPA enforcement records; ChemAlliance industrial chemical distribution compliance.
10. ITAR and EAR export compliance (defense-adjacent)
If any customers are defense contractors or aerospace OEMs, the distributor may unknowingly be in scope for ITAR (International Traffic in Arms Regulations) or EAR (Export Administration Regulations). Violation fines are $1M+ per occurrence and criminal. Common in fluid power, bearings, and electrical distribution selling into the defense supply chain. Cross-source: BIS export compliance guide; DDTC ITAR fundamentals.
11. Distribution agreement assignment language
Distribution agreements without assignment clauses or with explicit “non-assignable without consent” language require supplier consent at close. Suppliers can use that consent right to extract concessions, change terms, or terminate. Cross-source: MDM “Distribution Agreement Assignment” 2024; ABA distribution law section practice guide.
12. Pricing discipline records and margin compression evidence
If gross margin has compressed 100+ bps over the last 3 years (common in commodity electrical or PVF distribution), the buyer’s QoE asks why. Common answers (price competition, supplier cost increases not passed through, channel mix shift) reduce the multiple. Cross-source: Capstone Distribution Q4 2025; First Page Sage distribution multiples 2025.
13. Accounts receivable aging and bad debt history
Industrial distribution has long AR cycles (Net 60 to Net 90 common for industrial customers). DSO above 60 days, aged AR above 90 days exceeding 10% of total, or chronic bad debt above 1% of revenue is a working capital and credit quality red flag. Cross-source: MDM Distribution KPI Benchmark 2025; CRF Distribution Credit Practices Survey 2024.
The 36-Month Exit Prep Timeline
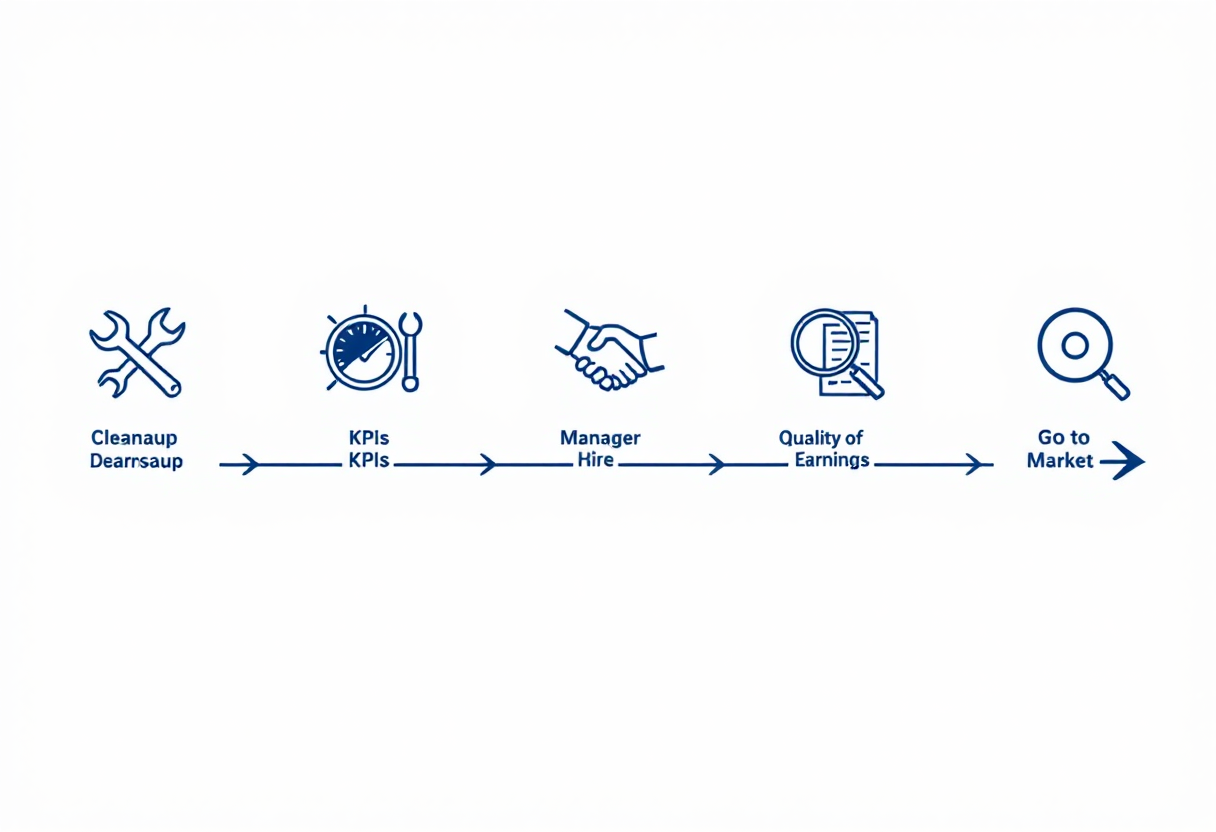
T-36 months: Cleanup phase
- Switch to accrual basis if still on cash basis
- Select and migrate to distribution-grade ERP (Eclipse, Epicor Prophet 21, Infor SX.e, SAP, or NetSuite)
- Start tagging every potential EBITDA add-back as it happens
- Conduct W-2/1099 audit on warehouse and delivery staff; reclassify if needed
- Re-strike related-party rent to FMV with appraisal
- Build the org chart and identify the CEO or GM hire (internal promotion target or external recruit)
- Phase I ESA on any owned warehouse property
- Multi-state sales and use tax compliance review (resale certificates audit, registration in nexus states)
- Begin DEA, EPA, and DOT compliance digital recordkeeping if applicable
- Initiate ITAR or EAR audit if defense customers exceed 5% of revenue
- Map top 10 suppliers and pull every distribution agreement for change-of-control language review
T-24 months: Financial discipline and KPI infrastructure
- CEO or GM hire onboarded and starting to take operational load
- Monthly close in 15 days; service-line and customer-level P&L every month
- KPI dashboard: inventory turns, DSO, DPO, gross margin by product, customer, and channel, VMI revenue %, online order %, customer retention
- Launch VMI program push if penetration is under 30%
- Begin private-label product introductions if mix is under 10%
- Pricing review: 4% to 8% list-price increases; rebate methodology documented
- Begin customer concentration diversification if top customer is above 15%
- Begin supplier concentration diversification if any supplier is above 25% of COGS
- Document SOPs for every operational role
- Build the add-back bridge as a living document
- Renegotiate top-10 supplier agreements where change-of-control language is weak
T-12 months: QoE-ready close discipline, eliminate owner dependence
- Owner steps out of daily operations; CEO or GM runs the business
- Owner takes a 2-week unplugged vacation as the stress test
- Run the sell-side QoE (budget $50K to $100K for a $1M to $5M EBITDA distributor)
- Tighten balance sheet: clean AR, write down obsolete inventory, isolate deferred customer rebate liability
- Final org chart review; backfill any gaps
- Final compliance scrub (sales and use tax certificates, DOT records, EPA, DEA, hazmat, ITAR, EAR, real estate environmental)
- Lock in 12 months of clean product-line and customer P&L for the CIM
- Cycle out 360+ day inventory to lift inventory turns into reportable range
T-6 months: Pre-marketing prep
- Engage an M&A advisor (sell-side investment bank specializing in industrial distribution: Capstone Partners, Lincoln International, Houlihan Lokey middle market, Lazard middle market, Harris Williams, Eaton Square distribution practice). Typical fee structure: $25K to $100K monthly retainer credited against success fee of 3% to 7% of enterprise value, modified Lehman scaling
- CIM drafted from the QoE and operating model
- Teaser drafted (anonymized 1-pager)
- Buyer list finalized (starting list of 25+ named buyers covering Imperial Dade, BradyPLUS, MCE, SunSource, KDG, ISS, Singer Equities, DSG, CHB, Bishop Lifting, Global Industrial, Tradesmen, EIS, Vallen, Veritiv, Singer Industrial, Applied Industrial, MSC, Fastenal, Sonepar, Rexel, WESCO, Border States, Ferguson, Watsco, Core & Main, Wurth, GPC, HD Supply)
- Virtual data room populated with everything from the pre-LOI and confirmatory sections above
- Management presentation deck built and rehearsed
T-3 months: Go to market
- Teaser distributed; NDAs collected; CIMs distributed to qualified parties (typically 30 to 60 outbound)
- IOIs collected 2 to 4 weeks after CIM
- Narrow to 5 to 8 finalists for management meetings
- Management meetings; LOIs solicited
- Select LOI; sign with exclusivity (typically 60 to 90 days for industrial distribution)
- Enter confirmatory diligence; close
End-to-end from advisor engagement to close: 9 to 12 months in a well-run process (Capstone Partners sell-side process guide; Auxo Capital Advisors sell-side primer; Lincoln International middle-market guide).
Frequently Asked Questions
How long should I plan for before selling my industrial distribution business to a private equity buyer?
The owners who get top-quartile pricing start preparing 24 to 36 months before going to market. The minimum useful prep window is 12 months, because most of the high-leverage levers (lifting VMI penetration from under 10% to 30%+, diversifying supplier concentration, installing a CEO or GM, migrating to a distribution-grade ERP, running a sell-side QoE) need 12+ months of clean trailing-twelve-months data to be credible to a buyer. Owners who try to sell in under 6 months typically leave 20% to 40% of enterprise value on the table.
What is a realistic EBITDA multiple for a $3M EBITDA industrial distribution business in 2026?
For a $3M EBITDA industrial distribution business in 2026, the range varies by sub-sector. PVF and industrial MRO sits at 7x to 10x. Electrical distribution sits at 8x to 11x. Fluid power and bearings sit at 8x to 11x. Janitorial and sanitary distribution sits at 8x to 11x (with Imperial Dade tier reaching 10x to 14x on platform-quality assets). Foodservice distribution sits at 8x to 12x. Specialty (cutting tools, abrasives, welding) sits at 8x to 11x. The bottom of each range applies to transactional-only distributors with under 10% VMI revenue, supplier concentration above 25%, and customer concentration above 15%. The top applies to distributors with 30%+ VMI revenue, supplier concentration under 15% of COGS, a CEO or GM in place, modern ERP running, and customer concentration under 10% (Capstone Partners Industrial Distribution Q4 2025; Eaton Square 2025; Generational Equity 2025). The 36-month prep playbook moves you from the bottom of the band to the top.
Should I get a quality of earnings report done before going to market?
For industrial distribution businesses at $1M+ EBITDA, yes. A sell-side QoE costs $50K to $100K typical for a healthy distributor with multiple product lines, multiple supplier rebates, and VMI revenue streams, up to $200K for multi-entity structures (Eton Venture Services 2025; Kahn Litwin Renza 2025). The ROI is leverage. A $75K QoE that supports a 1x multiple lift on a $4M EBITDA business at an 8x baseline is $4M of additional sale price, a 53x return (Eton “Quality of Earnings Report Cost” 2025). More importantly, a pre-market QoE surfaces supplier rebate accrual issues, inventory valuation surprises, and add-back weaknesses while you can still fix them, rather than during exclusivity when the buyer re-trades the deal.
What percentage of VMI and contracted recurring revenue do PE buyers want to see?
30%+ of revenue from contracted VMI agreements is the threshold that moves your business from commodity pricing into premium pricing. Transactional-only distributors with under 10% VMI revenue trade at the lower end of their sub-sector band. Distributors with 30%+ contracted VMI carry a +1.0x to +2.0x multiple premium (Eaton Square VMI valuation premium guide 2025; Capstone Partners Industrial Distribution Q4 2025; MDM “Why VMI Drives Distribution Multiples” 2024). VMI is the industrial distribution equivalent of the HVAC maintenance contract: contracted, switching-cost protected, and directly underwritable into a forward case. On a $3M EBITDA business, the VMI premium is $3M to $6M of additional sale price.
What level of supplier concentration is a dealbreaker for PE buyers?
Single supplier above 25% of COGS triggers buyer pushback. Above 30% of COGS or 40% of revenue, combined with a change-of-control termination clause in the distribution agreement, is a deal-killer or a 1.0x to 2.0x multiple haircut (Eaton Square 2025; Generational Equity Distribution Guide 2025; MDM “Distribution Agreement Diligence” 2024). Supplier concentration is the number-one distribution-specific deal-killer, more dangerous than customer concentration because the supplier holds the contract termination right. The fix is to add second and third suppliers in your top 3 product categories 18 to 24 months pre-sale, and to renegotiate the change-of-control language in your top-10 supplier agreements before going to market.
Will my supplier distribution agreements transfer to the new owner, or will my biggest supplier kill the deal?
It depends entirely on the assignment and change-of-control language in each agreement. Many industrial distribution agreements (especially with single-line manufacturers like Eaton, Parker Hannifin, ABB, Goodyear, S.C. Johnson, or Ecolab) contain explicit change-of-control termination rights or “non-assignable without consent” language that gives the supplier veto power over the transaction. The supplier can use that veto to extract concessions, change territory or rebate terms, or refuse to renew. The buyer will discover this in legal diligence and either restructure the deal with a large escrow holdback, make closing contingent on supplier consent letters, or walk. The fix is to pull every top-10 supplier agreement 18 to 24 months pre-sale, have legal review for change-of-control language, and renegotiate the worst clauses before the CIM ever goes out (Cross-source MDM “Distribution Agreement Assignment” 2024; ABA distribution law section practice guide).
What to Do Next
The industrial distribution owners who get the top-quartile multiple all do the same three things. They start preparing 24 to 36 months before they want to be out. They put a CEO or GM in place 12+ months pre-sale and physically remove themselves from the top-10 customer relationships and the qualifying-license role. And they invest in a sell-side QoE plus a supplier-agreement legal review before any buyer sees a CIM.
The Imperial Dade and BradyPLUS combination announced March 12, 2026 reset the buyer landscape for JanSan and foodservice distribution and reinforced the sponsor appetite across every industrial distribution sub-sector. With 22 of the top 50 distributors now PE-owned or PE-backed (up from 14 in 2020), 73 PE add-ons closed in 2025 alone, and median sub-sector multiples expanded 0.5x to 1.5x vs. the 2020-2022 baseline, the window for an owner-led exit at full price is open. The owners who waste it are the ones who try to fix supplier concentration, inventory turns, and owner dependence in the last 90 days before going to market.
If you are 12+ months from a potential exit and want a structured pre-sale optimization roadmap, CT Acquisitions has industrial distribution operations specialists in our partner network who run multi-quarter prep engagements covering VMI conversion, private-label rollout, supplier diversification, and ERP migration. If you are 6 to 12 months out and ready to start the sell-side process, our M&A advisory team runs the buyer outreach. No fee to you on buy-side introductions; sell-side mandates are paid on success at closing. Either way, the first 30 minutes are free.
Ready to talk?
Schedule a 30-minute exit-readiness call
Or read more: Sell Your Industrial Distribution Business (active sale guide) | Buying an Industrial Distribution Business (buyer’s playbook) | Private Equity in Industrial Distribution 2026: Active Buyers + Multiples
Ready to Explore Your Options?
A 30-minute confidential conversation is all it takes.