Business Valuation Multiplier in 2026: How EBITDA, SDE, and Revenue Multiples Really Work, With Sector Ranges
Business valuation multiples are the number buyers multiply earnings by: on average 2.0x to 3.1x SDE for deals under $2M and 4.1x to 5.5x EBITDA for $2M to $50M deals (IBBA Market Pulse, Q4 2025).
Key takeaways
- Size sets the starting multiple: IBBA and M&A Source members reported 2.0x SDE for deals under $500K and 5.5x EBITDA for $5M to $50M deals in Q4 2025 (Market Pulse Q4 2025).
- The yardstick switches at about $2M of purchase price: below it, deals are quoted on SDE (owner pay included); above it, on EBITDA (a market salary for a manager deducted), per the IBBA Market Pulse reporting convention.
- BizBuySell’s Q3 2026 Insight Report shows 2.30x cash flow for businesses sold under $1M and 3.73x above $1M, with the larger group a record 22% of 2,132 sales (Small Business Trends, October 2026).
- Private equity buyouts of $10M to $500M averaged 7.1x EBITDA in the first half of 2026, per GF Data figures in Mercer Capital, Fall 2026.
- Listed U.S. companies traded at 19.73x EV/EBITDA in January 2026 (Damodaran, NYU Stern); that figure is a ceiling check, not a private company benchmark.

What are business valuation multiples?
A business valuation multiple is the ratio of the price paid for a company to one measure of its earnings or revenue. A business sold for $1,550,000 with $500,000 of seller’s discretionary earnings traded at 3.1x SDE. Reverse the ratio to value your own business: normalized earnings times the multiple that comparable sales of the same size received.
Three bases cover nearly every private sale. The base matters more than the number: 4x SDE, 4x EBITDA and 4x revenue describe three very different prices for the same company, which is why every multiple quoted on this page names its base and its source.
| Multiple | Earnings base | Who quotes it | Typical published average | Source |
|---|---|---|---|---|
| SDE multiple | Pre-tax profit plus one owner’s pay, perks, interest, depreciation and one-time costs | Business brokers, SBA lenders, individual buyers | 2.0x to 3.1x (deals under $2M) | IBBA Market Pulse, Q4 2025 |
| EBITDA multiple | Earnings before interest, taxes, depreciation and amortization, after a market salary for management | Private equity, family offices, strategic buyers, lenders | 4.1x to 5.5x ($2M to $50M deals); 7.1x for PE buyouts | IBBA Q4 2025; GF Data via Mercer Capital, 1H 2026 |
| Revenue multiple | Annual sales | Software and high-growth buyers; a cross-check for Main Street deals | 0.42 to 1.2 across popular small business sectors | BizBuySell industry multiples |
For the earnings definitions themselves, our guide to SDE vs EBITDA in a business valuation walks through each add-back line.
Which multiple applies to my business: SDE or EBITDA?
Use an SDE multiple if the purchase price is likely under $2M and one owner works in the business full time; use an EBITDA multiple above $2M or where a paid manager runs operations. That $2M line is how the IBBA Market Pulse survey reports its averages for Q4 2025, and it matches how most brokers and lenders quote.
Comparing an SDE multiple with an EBITDA multiple without converting one into the other overstates the gap between them. SDE includes the owner’s salary; EBITDA deducts a market salary for whoever replaces the owner. The same price therefore produces a lower SDE multiple and a higher EBITDA multiple, as the two illustrative businesses below show.
| Line | Business A (priced on SDE) | Business B (priced on EBITDA) |
|---|---|---|
| Seller’s discretionary earnings | $500,000 | $1,200,000 |
| Less market-rate manager salary (assumption) | $150,000 | $200,000 |
| EBITDA | $350,000 | $1,000,000 |
| Multiple applied (IBBA Q4 2025 average) | 3.1x SDE ($1M to $2M band) | 4.1x EBITDA ($2M to $5M band) |
| Price | $1,550,000 | $4,100,000 |
| Same price as the other yardstick | 4.4x EBITDA | 3.4x SDE |
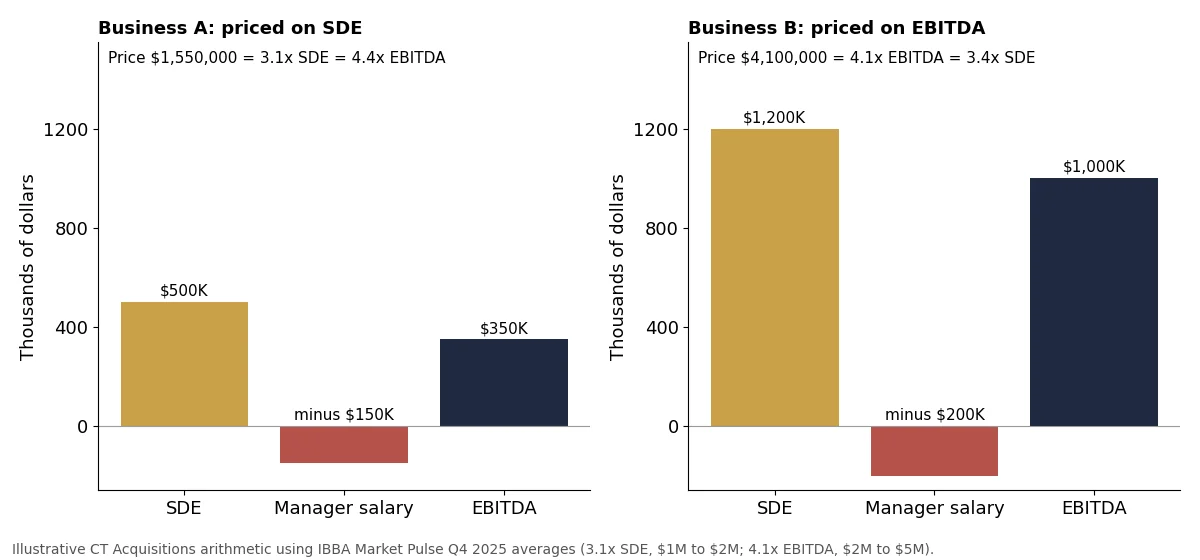
Several guides read the climb from about 3x to 4x or 5x as a pure size premium. On these illustrative numbers, 3.1x SDE equals 4.4x EBITDA, so most of the visible jump at the $2M line comes from changing yardsticks. The real size premium shows up further up the ladder, from 4.1x to 5.5x EBITDA in the IBBA data and from 6.4x to 9.7x in GF Data’s 2024 bands. The manager salary is the swing input: a $150,000 replacement cost on $500,000 of SDE is an assumption, and a buyer’s own estimate will move the conversion.
What are typical business valuation multiples by deal size?
Typical business valuation multiples climb from about 2x to 10x as deals grow. Main Street businesses under $1M of price sold at 2.30x cash flow in BizBuySell’s Q3 2026 data, lower middle market deals of $5M to $50M at 5.5x EBITDA (IBBA, Q4 2025), and private equity buyouts of $250M to $500M at 9.7x EBITDA (GF Data, 2024).
The ladder below stacks four independent datasets. Each one covers a different slice of the market, so read the row that matches your likely price, not the highest number on the page.
| Segment | Average multiple | Base | Period | Source |
|---|---|---|---|---|
| Businesses sold under $1M (median price $250,000) | 2.30x | Cash flow (SDE) | Q3 2026 | BizBuySell Insight Report via Small Business Trends |
| Deals under $500K | 2.0x | SDE | Q4 2025 | IBBA and M&A Source Market Pulse |
| Deals $500K to $1M | 3.0x | SDE | Q4 2025 | IBBA Market Pulse |
| Deals $1M to $2M | 3.1x | SDE | Q4 2025 | IBBA Market Pulse |
| Businesses sold above $1M (median price $1.8M) | 3.73x | Cash flow (SDE) | Q3 2026 | BizBuySell Insight Report |
| Deals $2M to $5M | 4.1x | EBITDA | Q4 2025 | IBBA Market Pulse |
| Deals $5M to $50M | 5.5x | EBITDA | Q4 2025 | IBBA Market Pulse |
| PE buyouts, $10M to $25M enterprise value | 6.4x | EBITDA | 2024 | GF Data, April 2025 |
| PE buyouts, $50M to $100M enterprise value | 8.3x | EBITDA | 2024 | GF Data |
| PE buyouts, $250M to $500M enterprise value | 9.7x | EBITDA | 2024 | GF Data |
| Listed U.S. companies (5,994 firms) | 19.73x | EV/EBITDA | January 2026 | Damodaran, NYU Stern |
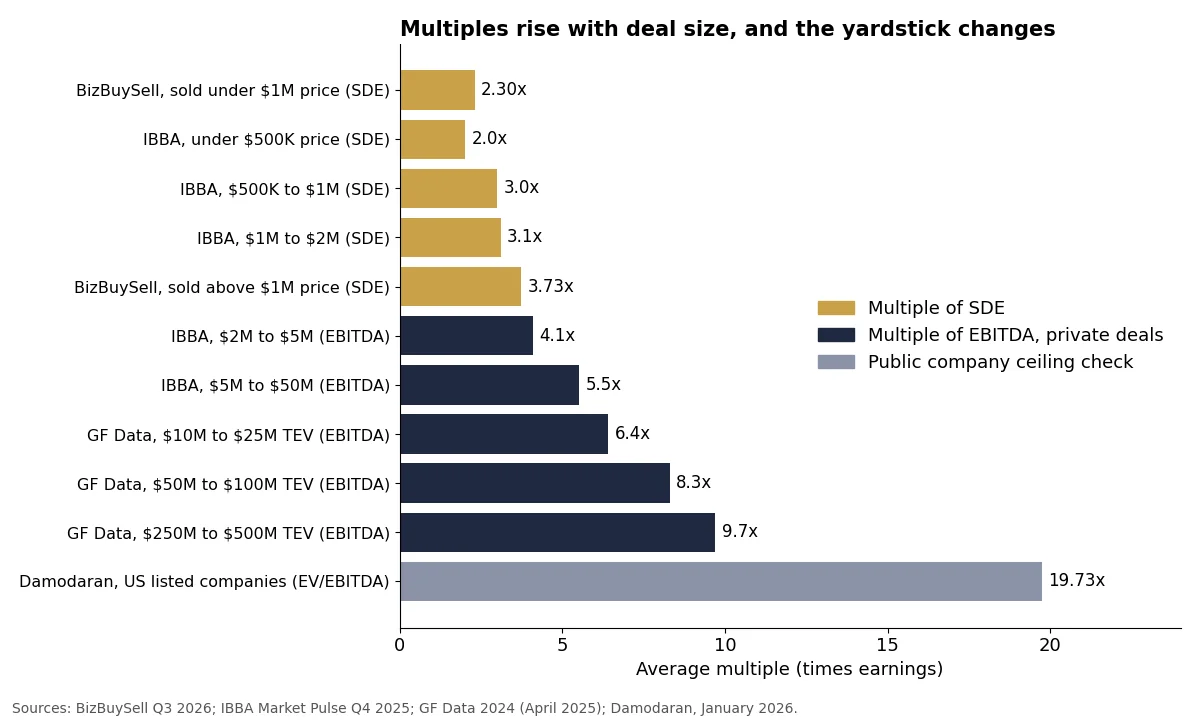
GF Data sorts deals by total enterprise value, not by earnings. At the 2024 average of 6.4x, the $10M floor of its smallest band implies about $1.6M of EBITDA, so a company below roughly $1.5M of EBITDA usually sits in the IBBA rows rather than the GF Data rows. The 19.73x public figure includes liquidity and scale that no private sale of this size carries.
How stable are these averages quarter to quarter?
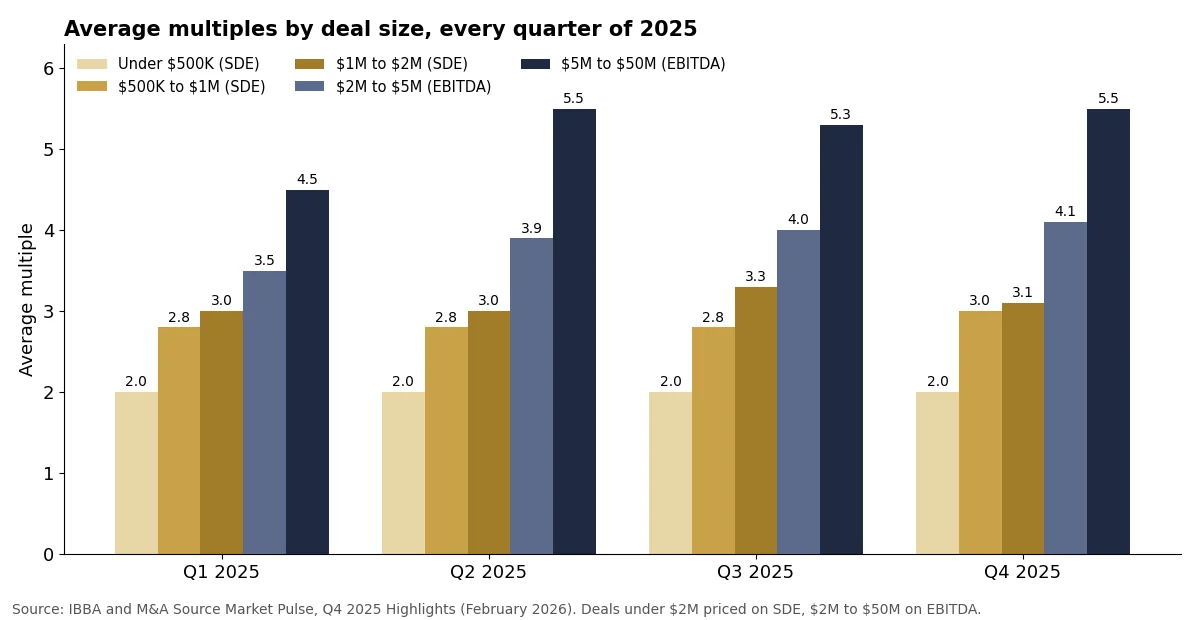
The smallest band barely moves; the largest swings by a full turn. The IBBA survey recorded 2.0x SDE for deals under $500K in all four quarters of 2025, while the $5M to $50M band ran from 4.5x in Q1 to 5.5x in Q4. A buyer quoting a single quarter’s average for a large deal is quoting a moving number.
| Deal size (base) | Q1 2025 | Q2 2025 | Q3 2025 | Q4 2025 |
|---|---|---|---|---|
| Under $500K (SDE) | 2.0x | 2.0x | 2.0x | 2.0x |
| $500K to $1M (SDE) | 2.8x | 2.8x | 2.8x | 3.0x |
| $1M to $2M (SDE) | 3.0x | 3.0x | 3.3x | 3.1x |
| $2M to $5M (EBITDA) | 3.5x | 3.9x | 4.0x | 4.1x |
| $5M to $50M (EBITDA) | 4.5x | 5.5x | 5.3x | 5.5x |
Where do sector ranges fit in?
Sector shifts the multiple less than size does. BizBuySell reports average earnings multiples of 2 to 3.3 across popular small business sectors and 2.58 across all sectors, a spread of 1.3 turns. GF Data’s first half 2026 averages for private equity deals run from 5.7x for technology to 7.7x for healthcare services, a 2 turn spread.
| Dataset | Sector or group | Average multiple | Source |
|---|---|---|---|
| Main Street sales | All sectors | 2.58x earnings | BizBuySell industry valuation multiples |
| Main Street sales | Popular sectors, low to high | 2 to 3.3x earnings | BizBuySell |
| Main Street sales | Popular sectors, revenue basis | 0.42 to 1.2x revenue | BizBuySell |
| PE buyouts, first half 2026 | Healthcare services | 7.7x EBITDA (8.5x in 2025) | GF Data via Mercer Capital |
| PE buyouts, first half 2026 | Business services | 7.5x EBITDA | GF Data via Mercer Capital |
| PE buyouts, first half 2026 | Manufacturing | 7.1x EBITDA (6.7x in 2025) | GF Data via Mercer Capital |
| PE buyouts, first half 2026 | Technology | 5.7x EBITDA (6.7x in 2025) | GF Data via Mercer Capital |
For sector-by-sector tables, use our EBITDA multiples by industry for 2026. For owner-run businesses priced on SDE, the SDE multiplier by industry lists sector medians.
What moves a business valuation multiple up or down?
After size, five things move a multiple: quality of financials, recurring revenue, owner dependency, growth and customer concentration. GF Data’s 2024 figures put a number on two of them: businesses with above-average financials sold at 7.7x against a 7.2x average, and deals where management stayed after closing at 7.4x. The other three have no public dataset that isolates them.
The right-hand column holds the adjustments CT Acquisitions uses as working rules when it sets a starting range. They are illustrative estimates, not measured averages; buyers apply their own.
| Driver | Published evidence | CT working rule (illustrative, turns of multiple) |
|---|---|---|
| Size | 2024 PE platforms: 6.7x at $10M to $100M TEV vs 9.2x at $100M to $500M (GF Data) | Sub-$500K EBITDA: lower end, often -0.5 to -1.0 |
| Quality of financials | Above-average financials 7.7x vs 7.2x all deals, 2024 (GF Data) | Accept documented add-backs only; see adjusted EBITDA |
| Owner dependency | Management staying post-close 7.4x vs 7.2x, 2024 (GF Data) | Very dependent -1.0; fully independent +1.0 |
| Recurring revenue | No public dataset isolates it | 0 to 15% recurring -0.5; 55%+ recurring +1 to +2 |
| Growth | No public dataset isolates it | Declining 5%+ a year -1.0 to -1.5; 15%+ sustained +0.8 to +1.5 |
| Customer concentration | No public dataset isolates it | Top customer 30%+ of revenue -1.0 to -2.0 |
| Buyer type | Manufacturing deals: public acquirers median 11.85x vs private acquirers 4.20x (DealStats via IndustryWeek, November 2026) | Price to the buyer pool that can underwrite synergies |
Each driver has its own guide: how owner dependency lowers business value, how customer concentration cuts a valuation and strategic vs financial buyers.
Worked example: from adjusted EBITDA to a value range
This illustrative example applies the IBBA Q4 2025 averages and the CT working rules to one company: $6.0M of revenue and $1.2M of adjusted EBITDA. The starting band runs 4.1x to 5.5x because a $1.2M EBITDA business prices across the $5M line, and the five adjustments net to +0.3 turns, giving 5.1x and about $6.12M.
| Step | Input | Multiple | Enterprise value |
|---|---|---|---|
| Low end: IBBA $2M to $5M average | $1.2M adjusted EBITDA | 4.1x | $4.92M |
| High end: IBBA $5M to $50M average | $1.2M adjusted EBITDA | 5.5x | $6.6M |
| Starting point: midpoint | Average of 4.1x and 5.5x | 4.8x | $5.76M |
| Owner somewhat dependent | CT working rule | -0.3 | |
| Recurring revenue 35% to 55% | CT working rule | +0.5 | |
| Growth 5% to 15% a year | CT working rule | +0.3 | |
| Top customer 10% to 20% of revenue | CT working rule | -0.2 | |
| Adjusted multiple and value | 4.8 – 0.3 + 0.5 + 0.3 – 0.2 | 5.1x | $6.12M |
Two cautions apply to this result. The $1.2M must survive the buyer’s quality of earnings review, so check each add-back against our guide to adjusted EBITDA add-backs. The enterprise value is also before debt payoff and the working capital peg, so cash to the seller at closing will be lower.
How do you calculate your own valuation multiple range?
Work in five steps: normalize earnings, pick the base that matches your likely price, read the average for that deal size from a dated dataset, adjust for the five drivers, and test the result against a second dataset. The output should be a range of about one turn, such as 4.6x to 5.6x, not a single number.
- Normalize earnings for the last 12 months. Start from tax returns or reviewed statements, then add back the owner’s pay and one-time costs to reach SDE, or deduct a market salary for a manager to reach EBITDA.
- Pick the base. If the likely price is under $2M, use SDE; from $2M upward, use EBITDA (IBBA Market Pulse convention).
- Read the size-band average. Use the IBBA Q4 2025 row for your price, or the GF Data 2024 band if enterprise value exceeds $10M.
- Apply the five drivers. Score owner dependency, recurring revenue, growth, customer concentration and financial quality, and move the multiple by the turns shown in the drivers table.
- Cross-check. Compare with BizBuySell’s 2.30x (under $1M) or 3.73x (above $1M) cash flow averages for Q3 2026, and discard any comparison to the 19.73x public market figure.
Our 90-second business valuation calculator runs the same five steps on your inputs and returns a multiple range.
Which multiple should you use for your situation?
Choose the base and the benchmark from the likely price and who will run the business after the sale. The table below turns the datasets on this page into rules with thresholds: under $2M and owner-run means SDE at about 2.0x to 3.1x; $2M to $50M with a manager means EBITDA at 4.1x to 5.5x; above $10M enterprise value means GF Data bands.
| If your situation is | Use this base | Benchmark to start from |
|---|---|---|
| Likely price under $500K, owner works full time | SDE | 2.0x (IBBA Q4 2025); 2.30x cross-check (BizBuySell Q3 2026) |
| Likely price $500K to $2M, owner runs operations | SDE | 3.0x to 3.1x (IBBA Q4 2025) |
| Likely price $2M to $5M, a paid manager runs day to day | EBITDA | 4.1x (IBBA Q4 2025) |
| Likely price $5M to $50M | EBITDA | 5.5x (IBBA Q4 2025) |
| Enterprise value above $10M and private equity interest | EBITDA | 6.4x at $10M to $25M, 8.3x at $50M to $100M (GF Data 2024); 7.1x average, 1H 2026 |
| Losing money or growing fast with recurring contracts | Revenue | 0.42 to 1.2x for Main Street sectors (BizBuySell); see revenue multiples guide |
| A buyer or adviser quotes a public company multiple | None | Discard: 19.73x (Damodaran, January 2026) is a listed company ceiling |
When revenue is the only workable base, the revenue multiple guide covers when buyers accept it.
Free, 90 Seconds
Get your specific multiplier in 90 seconds
The calculator starts from the deal-size multiple for your earnings, then applies the same five adjustments used in the worked example on this page: size, recurring revenue, owner dependency, growth and customer concentration.
The five pillars of how CT Acquisitions works
Confidential sales, recapitalizations and exit planning for owners of founder-owned businesses.
We work for owners on the sell side. Our fee is success only: nothing upfront, and you pay nothing unless the business sells.
Search funders, family offices, lower middle market PE and strategic buyers.
Introductions to the right buyers only. No public listing.
You see exactly how we are paid before any work starts.
No Pitch · No Pressure
Need a real-market view of your specific business?
Templates and frameworks give you a starting range. A 30-minute conversation gives you a market-based multiplier from someone who closes deals like yours. No pitch, no commitment, no charge.
How we compiled this
CT Acquisitions compiled this page in November 2026 from 8 documents: the IBBA and M&A Source Market Pulse Q4 2025 highlights, BizBuySell Insight Report coverage for Q2 and Q3 2026, BizBuySell’s industry multiples page, the GF Data Q4 2024 highlights, Mercer Capital’s Fall 2026 transaction update, Damodaran’s January 2026 EV/EBITDA dataset and an IndustryWeek summary of DealStats data. Worked examples and the turn adjustments are CT Acquisitions arithmetic and working rules, labeled illustrative. Forum posts were not used.
Frequently asked questions
Is a business worth 3 times profit?
For many small businesses, close to it, if profit means seller’s discretionary earnings. The IBBA Market Pulse for Q4 2025 shows 3.0x SDE for $500K to $1M deals and 3.1x for $1M to $2M deals, and BizBuySell reports 2.30x for businesses sold under $1M in Q3 2026. Companies sold on EBITDA above $2M averaged 4.1x to 5.5x.
How much is a business worth with $1,000,000 in sales?
Sales alone do not set the price; earnings do. If $1,000,000 of sales produces $200,000 of seller’s discretionary earnings, BizBuySell’s all-sector average of 2.58 times earnings implies about $516,000. BizBuySell’s revenue multiples of 0.42 to 1.2 give a cross-check range of $420,000 to $1.2M, which is too wide to price on.
What is the typical valuation multiple for a business?
Typical multiples depend on deal size. IBBA Market Pulse averages for Q4 2025 run from 2.0x SDE for deals under $500K to 5.5x EBITDA for $5M to $50M deals. Private equity buyouts tracked by GF Data averaged 7.1x EBITDA in the first half of 2026, per Mercer Capital’s Fall 2026 update.
How do you calculate a valuation multiple?
Divide the price paid by the earnings measure it was paid for. A business sold for $1,550,000 with $500,000 of SDE traded at 3.1x SDE. To value your own business, reverse it: multiply normalized SDE or adjusted EBITDA by the average for your deal size, such as 4.1x EBITDA for $2M to $5M deals in the IBBA Q4 2025 data.
What is a good EBITDA multiple for valuation?
A good EBITDA multiple is one above the average for your size band. For $2M to $5M deals the IBBA Q4 2025 average was 4.1x and for $5M to $50M deals 5.5x. In GF Data’s 2024 figures, businesses with above-average financials sold at 7.7x against a 7.2x average for all private equity deals.
What is the formula for valuing a small business?
The common formula is value equals normalized earnings times a market multiple. For an owner-run business under a $2M price, earnings means seller’s discretionary earnings and the multiple is about 2.0x to 3.1x (IBBA, Q4 2025). Then subtract debt the buyer will not assume and adjust for working capital set in the purchase agreement.
Sources
- IBBA and M&A Source, Market Pulse Q4 2025 Highlights (February 2026), accessed November 2026.
- Small Business Trends, BizBuySell Q3 2026 Insight Report coverage (October 28, 2026), accessed November 2026.
- Small Business Trends, BizBuySell Q2 2026 Insight Report coverage (August 2026), accessed November 2026.
- BizBuySell, Business Valuation Multiples by Industry, accessed November 2026.
- GF Data, Highlights and Products, Fourth Quarter 2024 (April 2025), accessed November 2026.
- Mercer Capital, Middle Market Transaction Update, Fall 2026, accessed November 2026.
- Aswath Damodaran, NYU Stern, Enterprise Value Multiples by Sector (US), January 2026, accessed November 2026.
- IndustryWeek, EBITDA Valuations for Manufacturing Companies (November 2, 2026), accessed November 2026.
Related research
- Free Business Valuation Tool, your business is worth in 90 seconds
- The Business Broker Alternative Guide (national pillar)
- Business Brokers by State, with a confidential alternative
- The Complete Guide to Selling Your Business in 2026
- What’s My Business Worth? Founder’s Valuation Guide
- Who Buys These Companies? Buyer Types Explained
- How to Sell to Private Equity, A Founder’s Walkthrough
- Owner’s Pre-Exit Checklist, 90 Days Before You List
- CT Commentary, Founder & M&A Insights